22 Sep 2022 How Americans Spent Their Money in 2021
Each year, the Bureau of Labor Statistics releases the findings of their Consumer Expenditure Surveys (CE), which track the earnings and expenditures of American households. The first survey was done in 1888, though it didn’t become an annual tradition until 1984, and is packed with useful information like what percentage of household spending went to “other meats,” “Pets, toys, hobbies, and playground equipment,” and clothing for “Men, 16 and over.” They get pretty granular, and while they do track spending on “Alcoholic Beverages,” I can’t imagine the people compiling this data would be much fun to have a beer with.
Though the survey gets quite detailed, the BLS tries to be helpful by grouping spending into seven major categories:
-
- Food
- Housing
- Apparel and Services
- Transportation
- Healthcare
- Entertainment
- Other Expenditures
The groupings aren’t perfect. Spending for what most people call “Travel” gets lumped into three BLS categories: Housing, Transportation, and Food. Also the “Other Expenditures” category contains a few important sub-categories: “Cash Contributions” (charitable giving, support for family/friends outside of the household, etc.), and saving and investing, to name two (though they don’t call it “saving and investing,” as you’ll see below). The data doesn’t translate perfectly to the real world but can still be very helpful.
In 2021, the BLS gathered data from 133,595,000 households and placed them into one of nine income groups:

For our purposes, we will focus on the latter three groups where, on average, each household contains two wage-earning adults between the ages of 48-49, and one child under the age of 18. Total average annual expenditures for the three income groups look like this:
-
- $100,000-149,999: $85,078 (~$7,000/month)
- $150,000-$199,999: $108,334 (~$9,000/month)
- $200,000 and more: $162,477 (~$13,500/month)
Here’s where they spent their money in 2021 (I’ve broken out a few of the categories the BLS puts under “Other Expenditures” in order to make the data more meaningful. Also, this omits all income taxes):
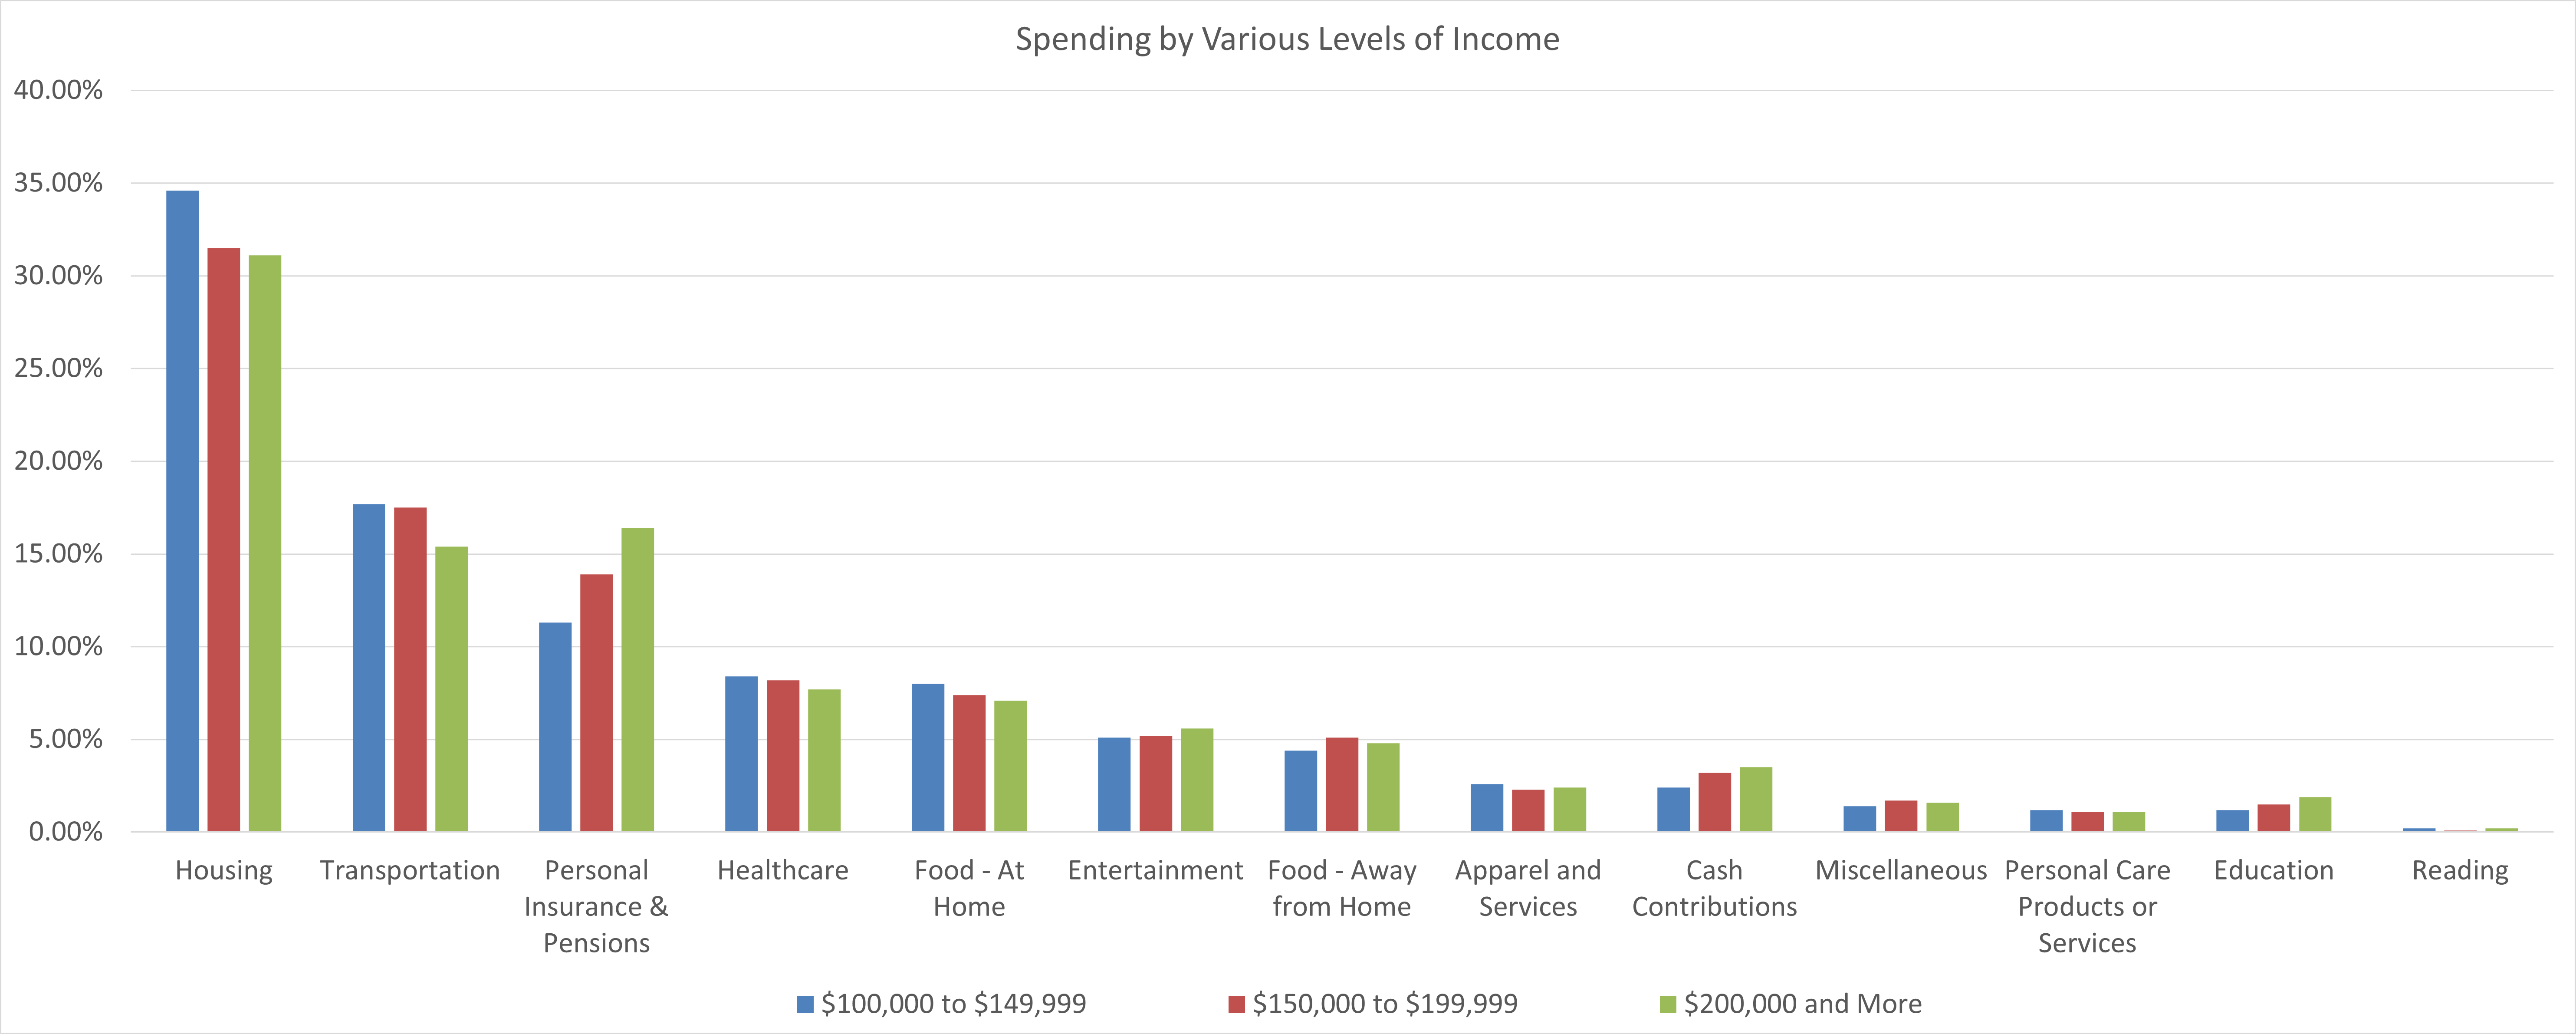
The three largest categories of spending were housing at 30-35% (mortgage, utilities, property taxes, furniture, housecleaning, hotels, etc.), transportation at 15%-18% (used or new purchases, fuel, finance charges, maintenance and repairs, insurance, airfare, public transportation, etc.), and food, between 11.9-12.5%. As you can see, I divided food by “At Home” and “Away from Home” with the average household spending two-out-of-every-three dollars at home. (You can see exactly what’s in each category of spending here.)
In total, the average household with earnings greater than $100K spends between 57%-65% of their budget on where they live, what they drive, and what they eat.
As you can see, there’s very little difference in spending by category across the three income groups, except when it comes to “Personal Insurance & Pensions,” which covers all kinds of insurance premiums (except for home, auto, and health), Social Security taxes, pension contributions, and retirement plan contributions. Digging in to the data, the difference can be attributed to levels of saving, not insurance premiums.
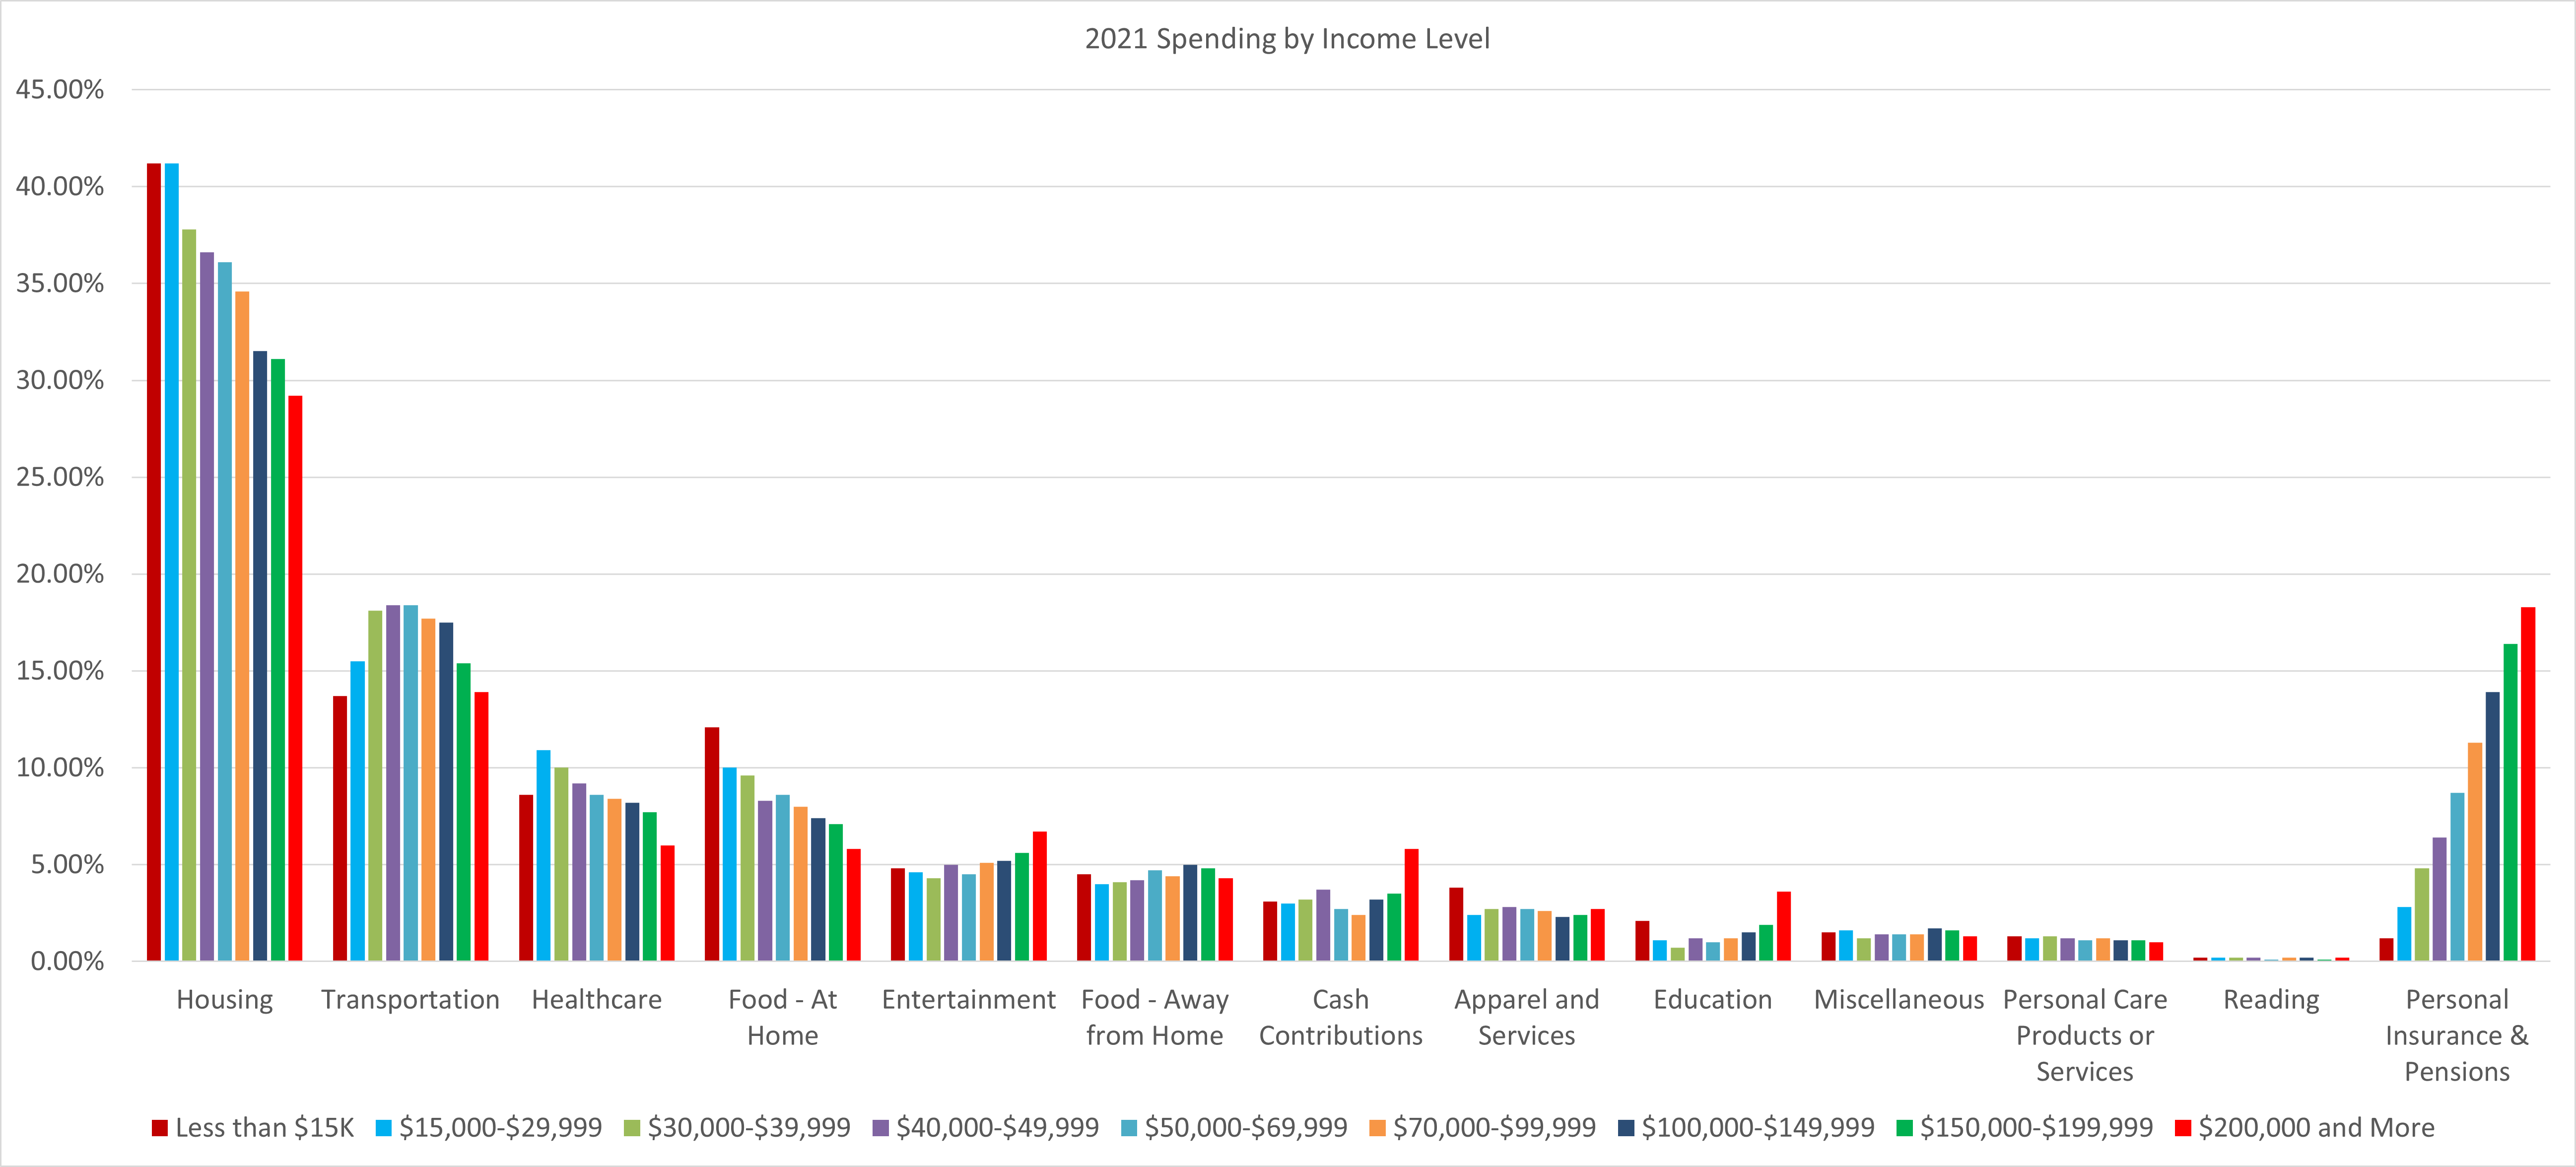
If you’re curious what spending looks like across all income groups, here you go:
All this is to say, the BLS CE survey is helpful in that we frequently get asked, “What should my budget look like? Are we spending too much on ______?” While the survey’s findings are averages, something none of us are, and the groupings aren’t perfect, they can still be instructive by showing major disparities between our spending and the averages. If the typical three-person household making more than $100K spends 4%-5% of their budget eating out, but you spend 8%, for example, that category of spending probably deserves a hard look. Or, considering nearly two-thirds of our total spending is on our homes, our transportation, and our food, practicing discipline/restraint in these areas has a much larger impact than saving 10% on auto insurance or waiting for a pair of shoes to go on sale. Not that either of these are bad things (I’ve celebrated with co-workers after waiting months for a pair of $140 shoes to drop to $90), but a lot of financial advice seems to be preoccupied with smaller line items that don’t move the needle in your annual spending.
Understanding your spending is one of the most important, if not the most important, habits in personal finance. Your spending may mirror the average American, or it may look wildly different. What matters is understanding it, applying it to your financial plan, and, if necessary, making any adjustments to ensure long-term financial health.
If you need help getting started, let us know.
The content above is for informational and educational purposes only. The links and graphs are being provided as a convenience; they do not constitute an endorsement or an approval by Beacon Wealthcare, nor does Beacon guarantee the accuracy of the information.