30 Dec 2020 Five Charts that Summarize 2020
After a year like 2020, it is impossible to avoid a hyperbolic statement like, “it’s been a crazy year!” because it has been a crazy year. Here’s just a few of the significant occurrences: a worldwide pandemic that shuttered the global economy and claimed hundreds of thousands of lives in the U.S. alone, the impeachment of Donald Trump, the second fastest bear market in history, the best November for the S&P 500 in 92 years, a stock market rally of over 60% since the bottom in late March, the best April in 82 years (also the best month in 33 years), a Presidential election, ground-breaking work in the field of vaccines, specifically, and medicine, generally, oil prices turning negative for a day, and social and racial unrest.
2020 has been a year.
As it comes to a close, I wanted to share a few charts that summarize what’s taken place in the stock and bond markets, as well as the economy.
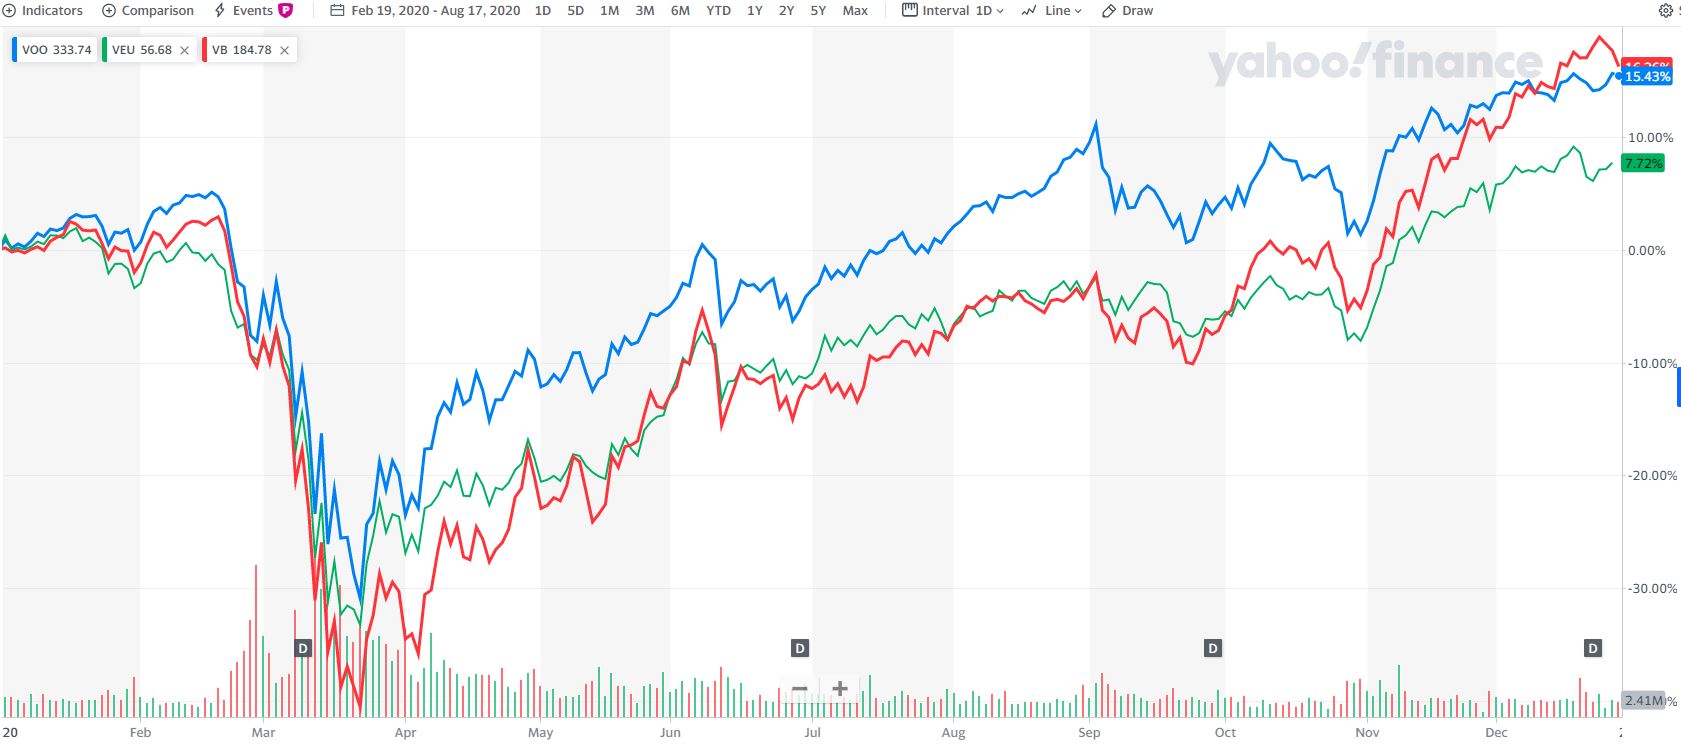
The first chart shows year-to-date (YTD) performance through 12/28/2020 of three stock exchange traded funds (ETFs). Blue is the Vanguard S&P 500 Index, red is the Vanguard Small Cap Index, and green is a word/letter-soup (Vanguard FTSE All World Ex-US ETF) that represents the entire global stock market less the United States. We all remember the draw-down from February 19th though March 23rd, but equally noteworthy is the recovery in prices since then. Through December 28th, international stocks are up 7.72%, the S&P 500 is up 15.41%, and small cap stocks are up 17.68%. It has truly been a remarkable year.
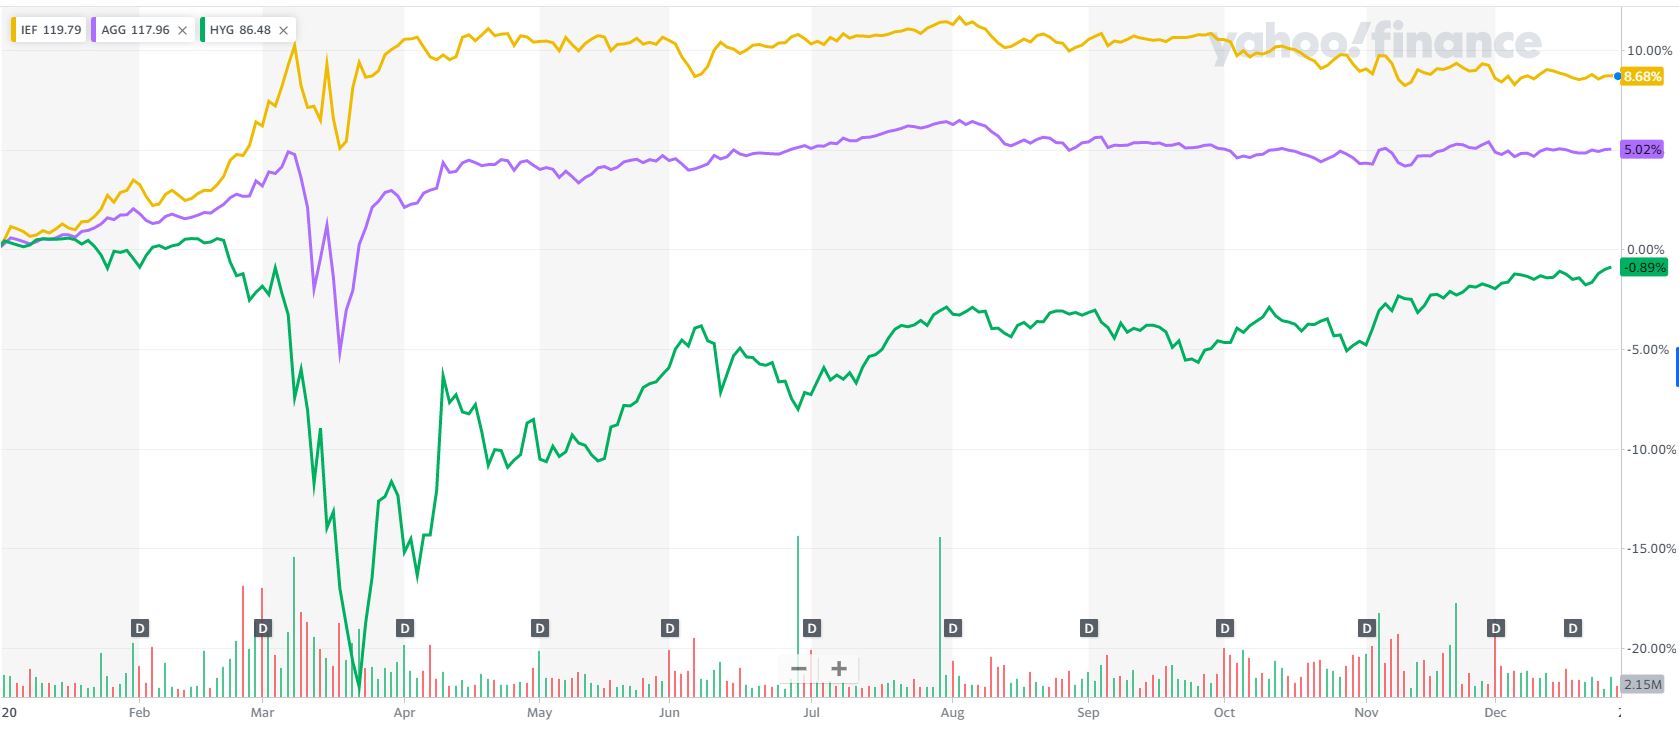
What about bonds? The second chart shows the performance of three bond ETFs: Gold depicts the iShares 7-10 Treasury Bond (our core bond holding), purple is the iShares Core U.S. Aggregate Bond ETF, which represents the investment-grade corporate bond market, and green is the iShares iBoxx $ High Yield Corporate Bond ETF. These bonds are commonly referred to as “junk” bonds and were crushed right at the outset of the pandemic and have yet to recover. Corporates initially rose, then dropped about 10% before rebounding to be up a bit over 5% YTD. Treasuries rose, dipped, rose again, then leveled off and are up 8.6% YTD.
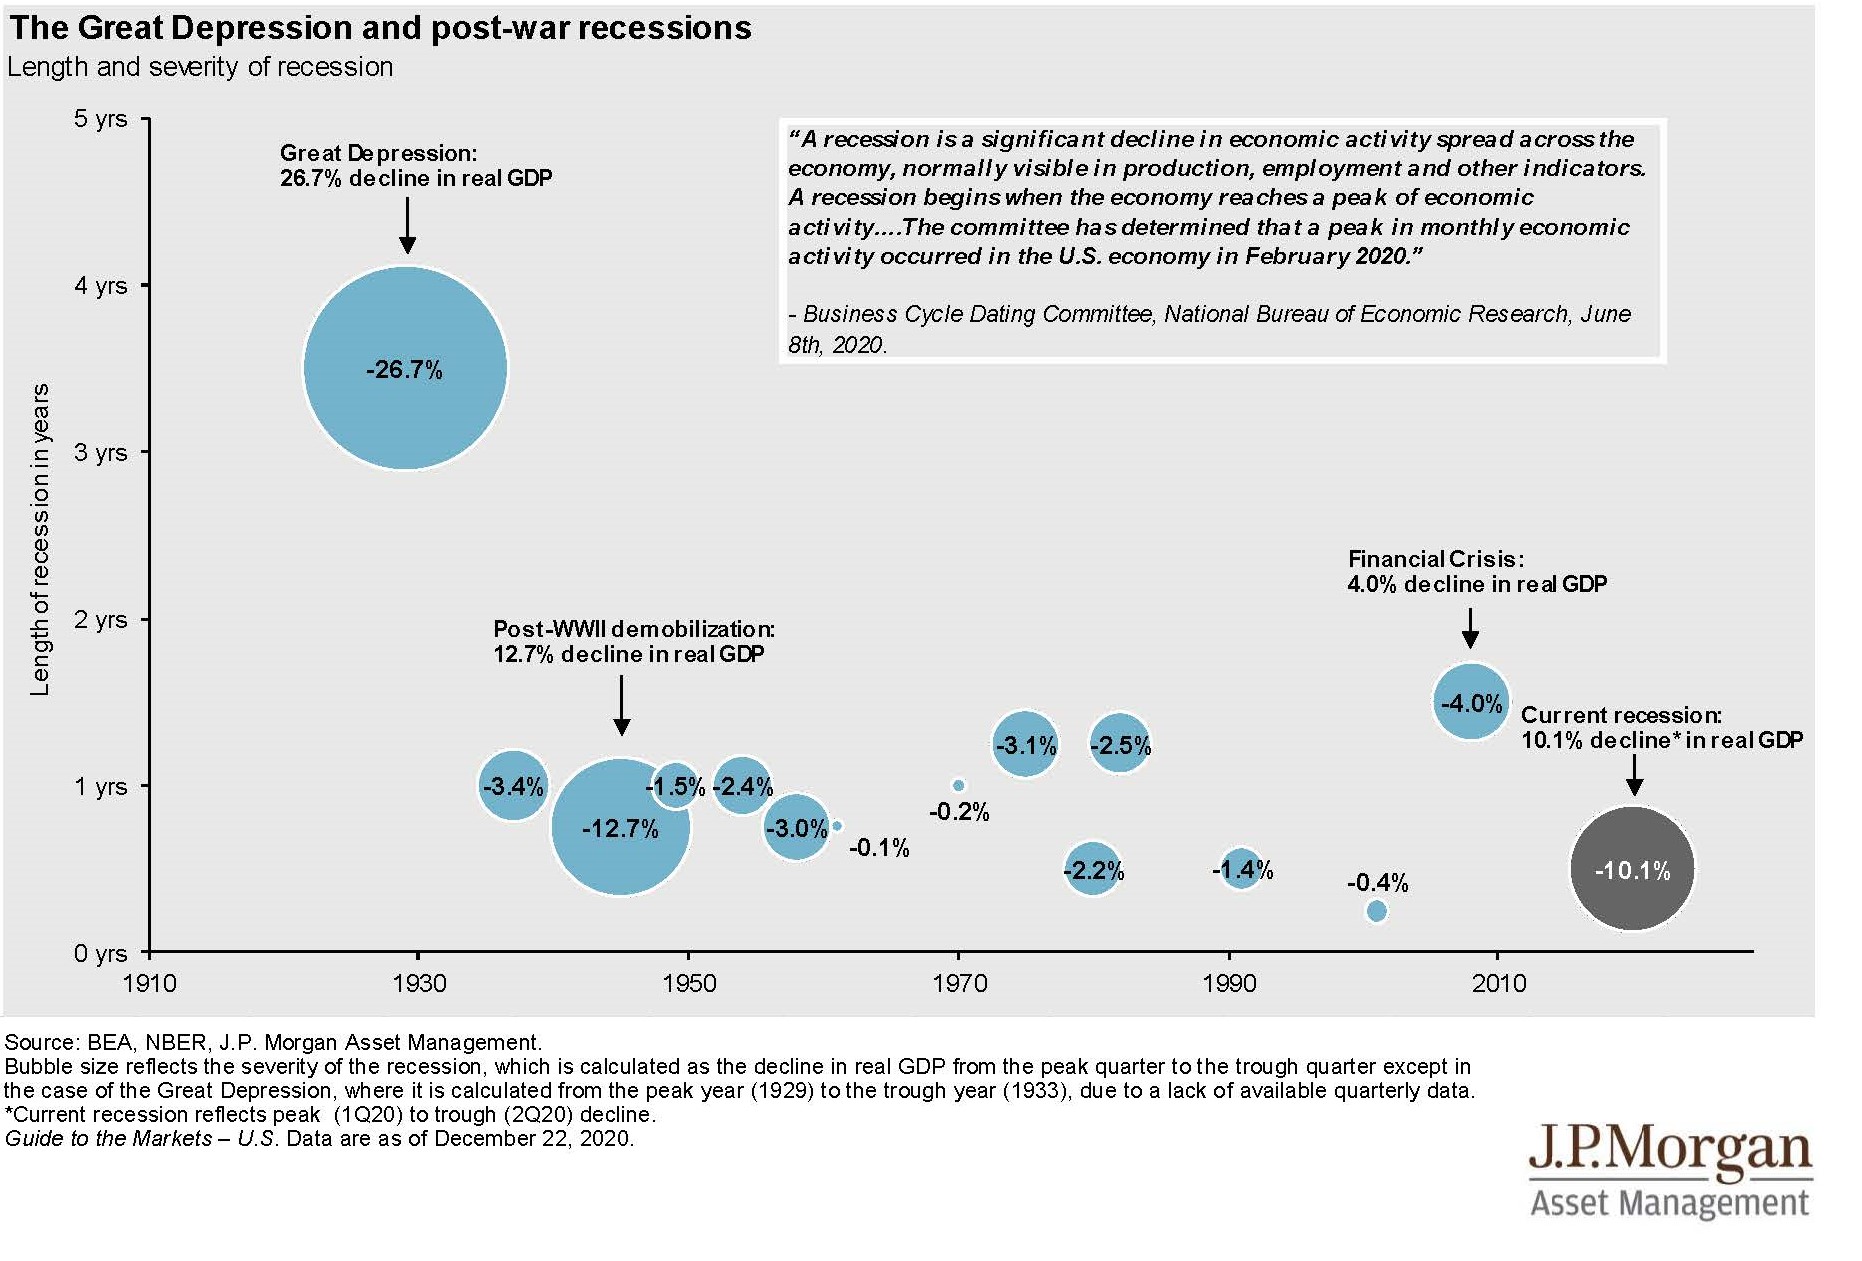
What about the economy? Well, we entered into a recession this year with economic contraction for two straight quarters: -5% in Q1 and -31.4% in Q2. Thankfully, Q3 saw the economy rebound by 33%, but the recession of 2020 caused our economy to shrink by -10.1%, the third largest, though one of the shortest, contractions since 1910, as you can see below:
The positive news from an economic standpoint is that the Federal Reserve anticipates GDP to decrease by just -2.4% this year. That’s a significant upward adjustment since a statement they made in September where they said the economy would shrink by -3.7%. Fed expectations for 2021 are the economy will grow by 4.2%.
It’s an understatement to say COVID-19 shuttered the economy. Still, knowing this, no matter now many times I see the chart below it always makes me gasp:
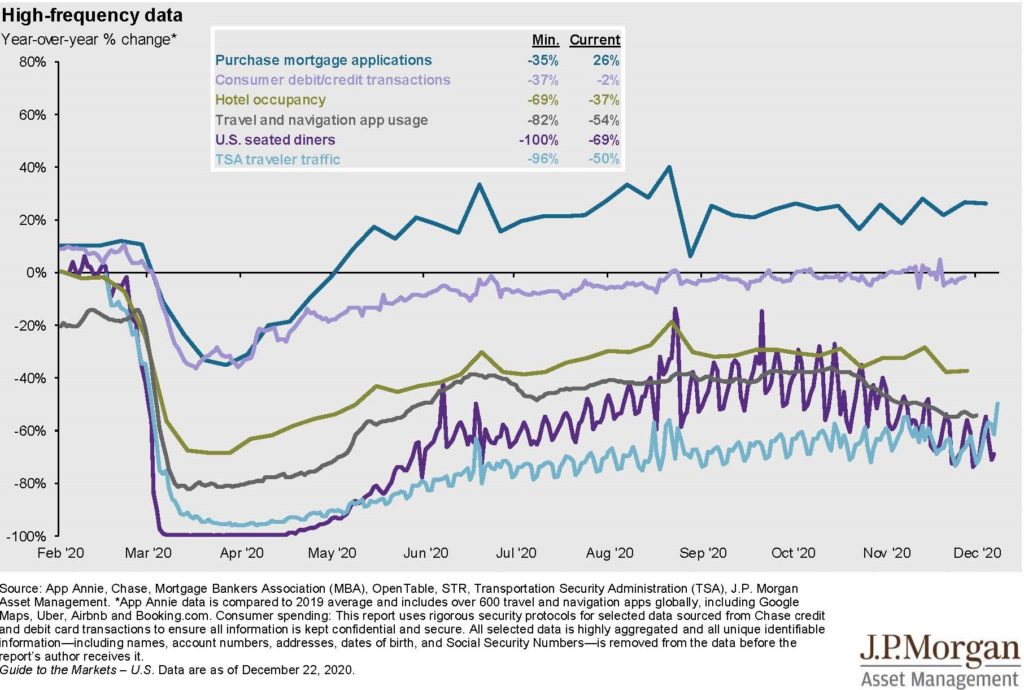
What you see is “High Frequency Activity”: mortgage applications, credit and debit card transactions, hotel occupancy, “travel and navigation app usage”, seated diners, and TSA traveler traffic. It’s stunning how hotel, restaurant, and travel activity just stopped. Mortgage apps are up and transactions have recovered, but much of the “high frequency” data remains stunted and presumably will stay that way until the vaccines are widely distributed.
The final chart depicts the Price-Earnings Ratio (P/E), which is helpful for evaluating if the stock market is “expensive” or “cheap”. As you can see, the historical average is around 16.5 and right now the market is sitting a bit above 22, telling us that that the market is expensive. This also speaks to the disconnect between the stock market and the economy this year. How can stocks be so expensive, how can the market be doing so well, when the economy is struggling mightily? The answer, albeit an unsatisfying one, is that the stock market is not the economy.
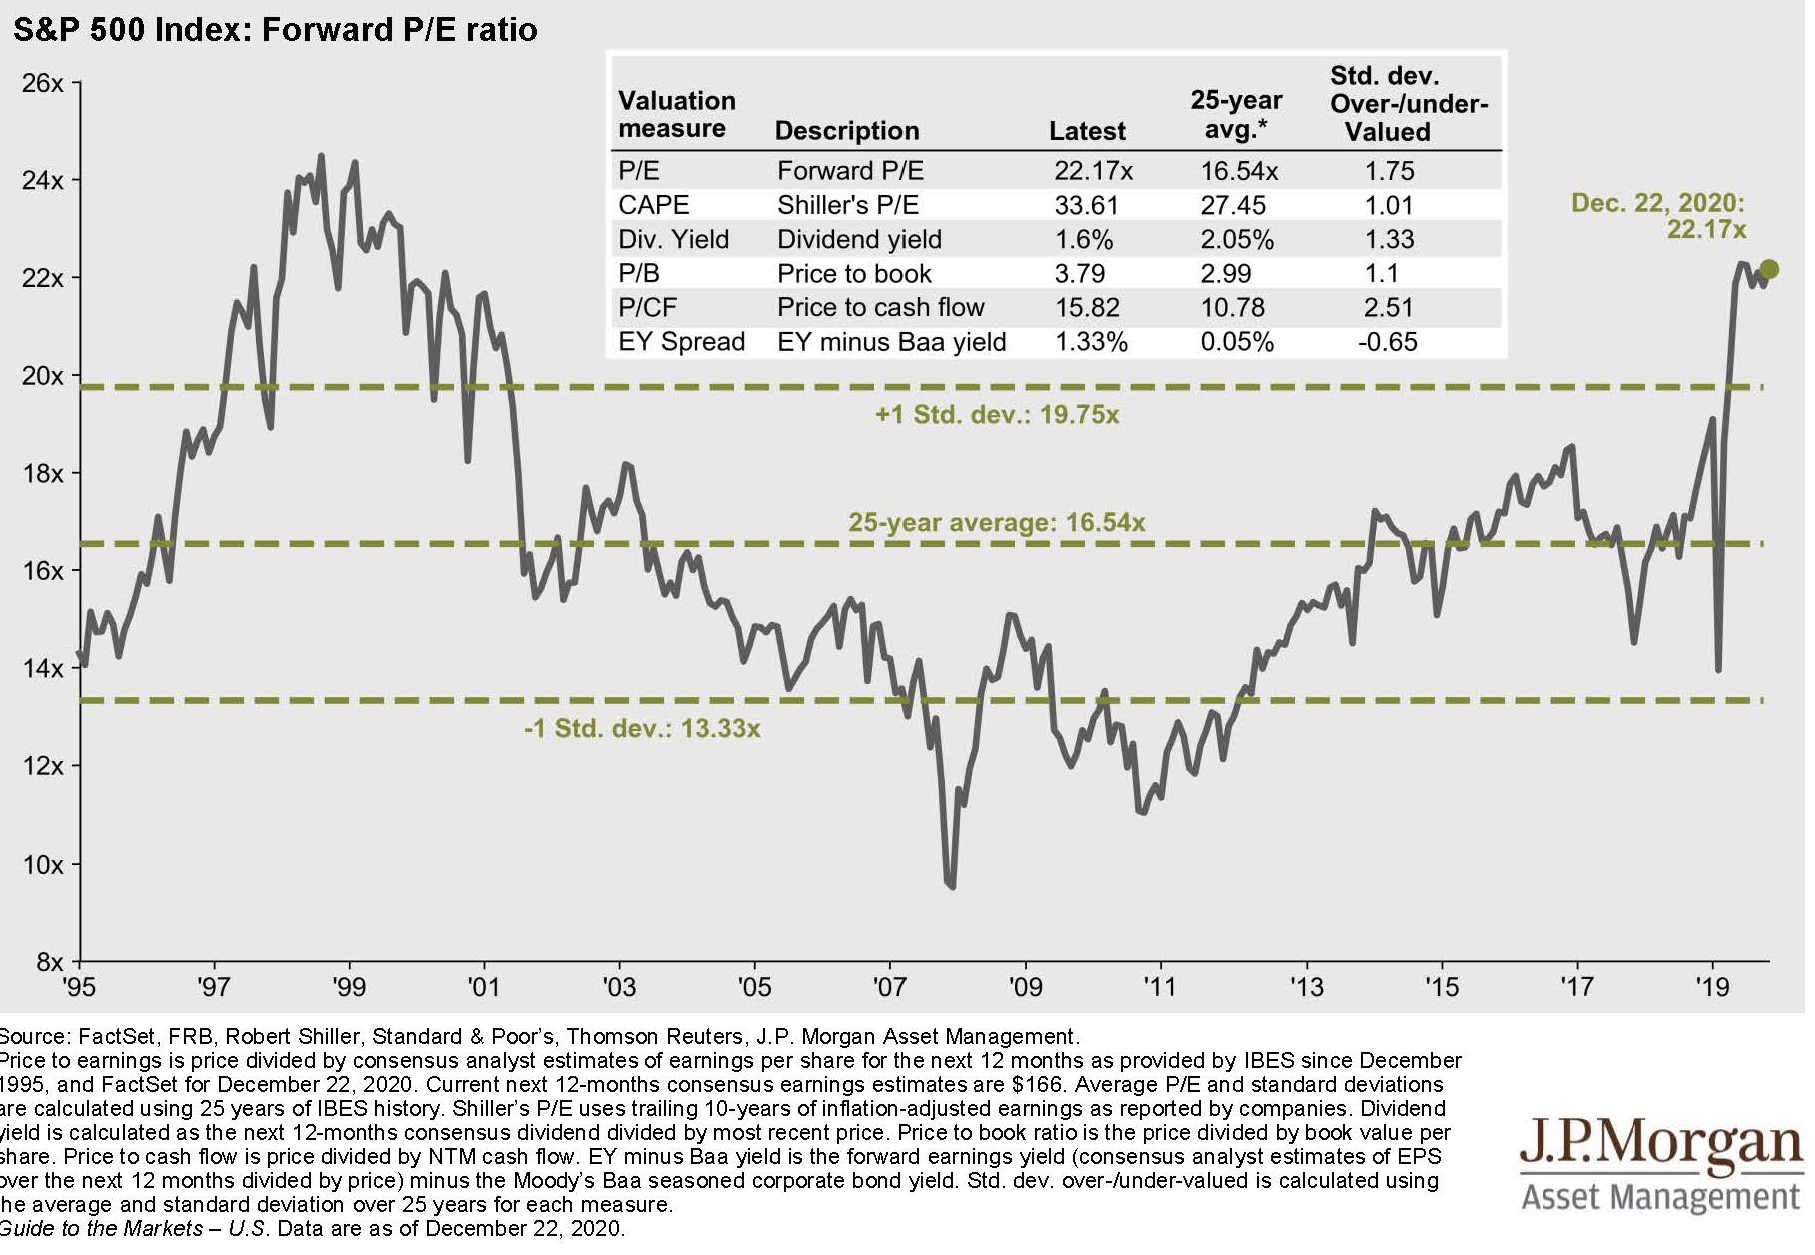
What the P/E is not good for is indicating where the market is headed in the next 12 months, so don’t look at this chart and take it as a sign it’s time to exit the stock market. To “normalize” valuations stocks could fall (quickly or gradually) or earnings could increase (quickly or gradually), or some combination. Earnings are expected to increase next year, which will help close the gap and the faster the vaccines can be delivered the better the odds of that. My reason for sharing this particular chart isn’t to cause alarm, but more to communicate that stock market returns over the next few years probably won’t be what they have been the last two years.
As we wrap up 2020, all of us at Beacon Wealthcare want to thank you for your commitment to our firm and generosity in sharing our name with your friends and colleagues. We are also grateful for the concern you’ve showed for us, as during many of our calls during the early, trying days of the pandemic where we meant to check on you, you were kind enough to also ask how we were doing.
Thank you for allowing us to serve you while doing something we love. Happy New Year!