15 Jan 2026 A Look Back at 2025
At the start of the year, I like writing about what took place in the preceding 12 months because it’s a helpful reminder of the ground we covered, and there’s always a lesson or two that can be applied going forward. Most important, and this is especially true when the market has a really good year, we’re reminded of how much uncertainty there was and how many times along the way we, as investors, felt uncomfortable.
There were more than a handful of noteworthy events and themes last year: the return of a President, tariffs, AI, the longest government shutdown in U.S. history, “affordability” taking center stage, inflation moderation, the passage of a new tax law, and the Fed cutting rates. With these things in mind, let’s take a look back at some important numbers from 2025.
Investment Returns
In short, the major asset classes had a great year, as you can see below:

What immediately jumps out is how international stocks, represented by the AC World Ex-US Index, handedly outperformed U.S. stocks. We haven’t seen anything like this since the early 2000’s when international equities dominated the U.S. The Financial Crisis put a stop to that, so it will be interesting to see if international continues to do better or if it was a one-off occurrence that can largely be attributed to tariffs. Considering that the devaluation of the U.S dollar accounted for roughly 40% of the total return, my money is on the latter.
It’s also great to see bond returns in the high-single digits. The Fed’s Zero Interest-Rate Policy made fixed income hard to hold for more than a decade, but interest rates have largely normalized, with current yields on the 10-year treasury in the 4-4.2% range, making them a more attractive option.
U.S. vs. The World
As I mentioned, the U.S. lost to “The World” last year, but one year is not a trend. It’s more instructive to look back from today to the bottom of the Financial Crisis. With that perspective, the magnitude of U.S. outperformance is staggering:
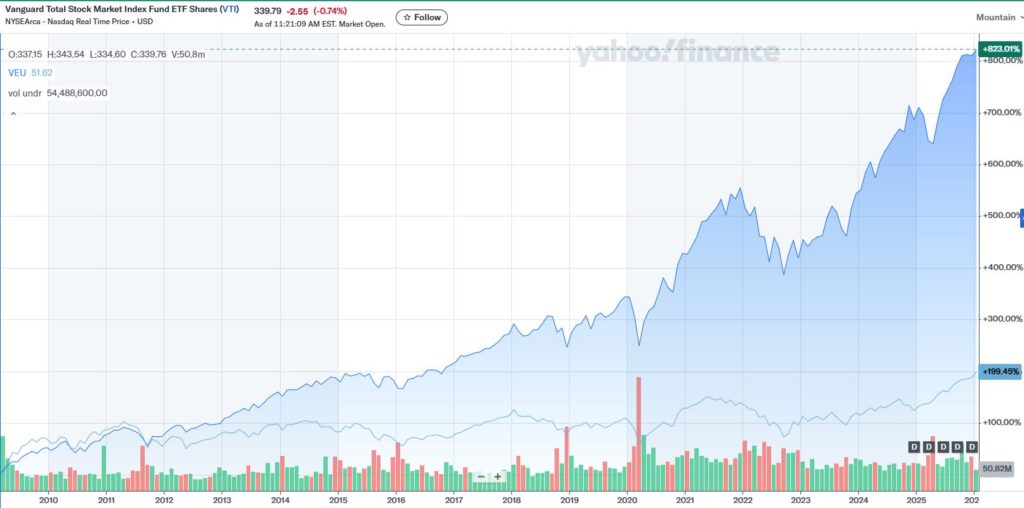
The chart above shows two investments: The Vanguard Total Stock Market Index ETF (U.S. equities ) and the Vanguard FTSE All World ex-US ETF (everything outside the U.S.). The shaded blue is the former and the green squiggly line is the latter. Since March, 2009, the U.S. has boat-raced the world, with an increase of 823% versus 199%.
The question is whether or not we’re at the start of a reversal. My instincts tell me no, but, and this is good for all of us, we don’t make investment decisions based off my instincts.
The Markets React to Tariffs
It would be easy to look at the final numbers and think last year was smooth sailing; it was not. In early April, President Trump announced massive tariffs against most of the world, sending markets into a tail-spin. Since then, most countries have seen their tariff rate reduced or even eliminated, but the initial announcement was so unexpected that stocks, already down almost 8% in the six weeks preceding the announcement, cratered an additional 12% over the next five trading days. I wrote about what a surprise this was on April 10th of last year.

Thankfully, the resulting instability in the U.S. Treasury bond market caused enough concern that Trump quickly announced a 90-day pause. That, combined with actual tariffs being much lower than the initial announcement, allowed markets to stabilize and resume a steady, upward march.
All that said, drops like this are not uncommon. The chart below shows calendar year returns (gray bars) along with intra-year declines (red dots):
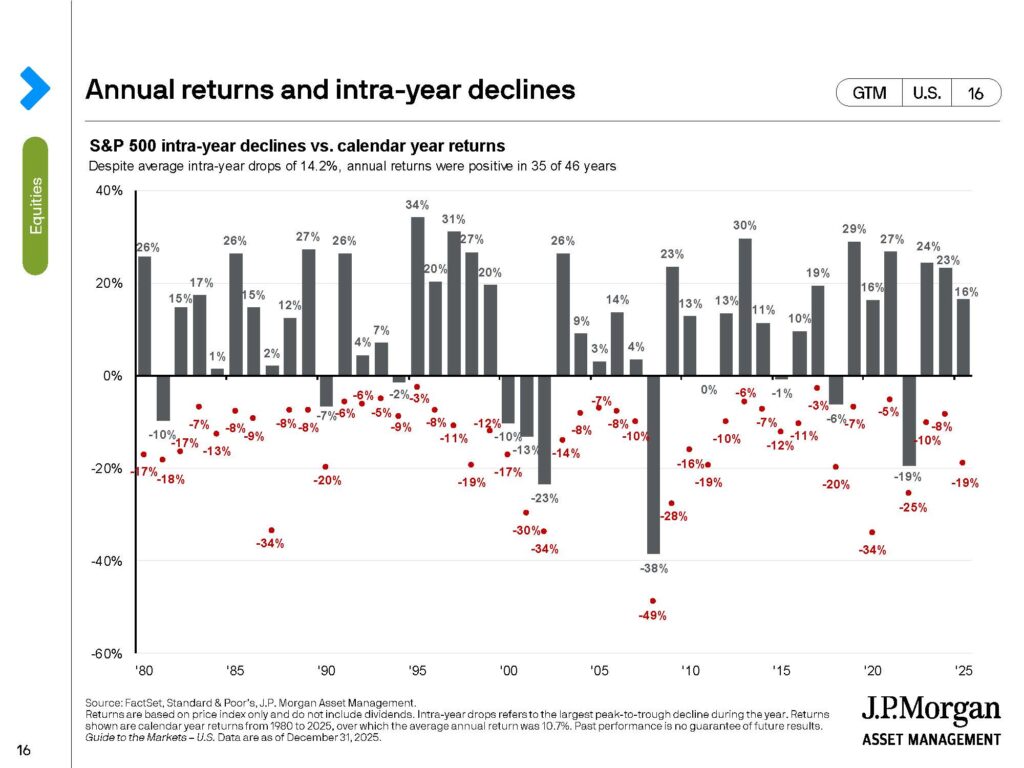
Going back to 1980, the average intra-year decline is more than 14%. Yet, in 35 of those 46 years (76% of the time), returns were positive. Investing involves uncertainty and, at times, discomfort. Just look at the last three years: 10% drop, 8% drop, 19% drop. Despite that, stocks have had the 12th best three-year run since 1930.
Inflation
The most watched number in economics right now, and it’s not particularly close, is the monthly inflation data. The change in prices impacts purchasing power, economic growth (G.D.P.), consumer confidence, and Fed policy. It’s a massive data point, and while the Fed isn’t yet satisfied, recent reports are encouraging. Looking at the chart below, you can see the spike that began soon after the onset of the pandemic and where we are now:
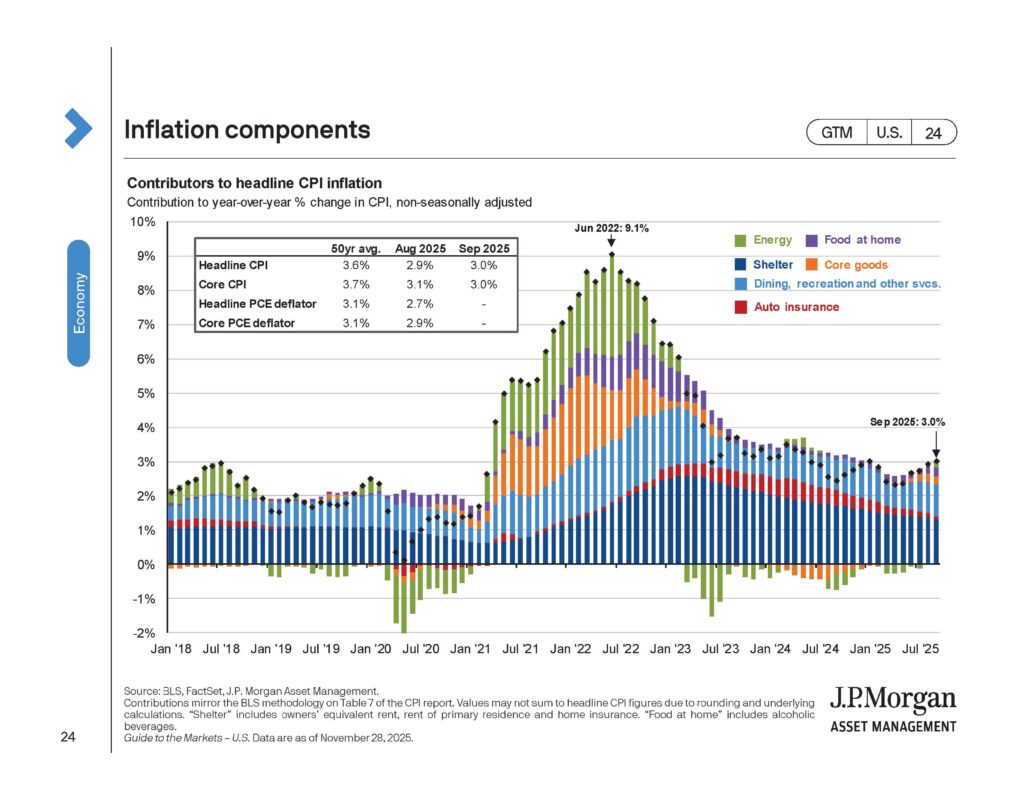
Everything increased beginning in 2021–energy (green), shelter (blue), food (purple), “core goods” (orange. Think: furniture, clothing, appliances, and vehicles), eating out (light blue)–with overall inflation peaking at 9.1% in June, 2022. We now sit at 2.7%, which is tolerable, but still above the Fed’s target of 2%. If inflation continues to ease, the Fed will feel more comfortable lowering interest rates, which makes everything more affordable.
Looking Ahead
2025 provided us with many reminders: affordability matters, the U.S. stock market isn’t untouchable, drops are common, and surprises are not well received, to name a few. But what about looking ahead?
At the moment, AI is the buzzy investment. Shoot, Rivian, the electric car company, jumped 50% in 2025, largely due to the news that they have developed their own AI-chip. Last year, Alphabet, Amazon, Meta, Microsoft, and Oracle, were projected to spend $350B on AI, up 40% from the year before, according to J.P. Morgan. That number is expected to reach $550B by 2027. AI, and tech in general, appear unassailable.

The final graphic shows the top 10 companies in the S&P 500 by decade. Looking at 1985, we laugh that Kodak was once one of the largest companies in the world. AT&T, really? A phone company? GE persevered in the top 10 the longest, from 1985 through 2015, but it’s now three separate companies. Walmart was untouchable, then Amazon showed up. AIG, Bank of America, and Citigroup were cruising in the early 2000’s, then the financial sector nearly ruined the U.S. economy.
Today’s winners can very quickly be tomorrow’s losers. Tech may continue to dominate the top 10, but that doesn’t mean it’ll be Microsoft, Nvidia, or Alphabet (Google). The point is, approaching investing by targeting individual stocks (at the micro-level) or sectors/countries (at the macro level) is an exercise in futility. Yes, you might hit a hot streak every now and then, but there’s a greater likelihood you’ll miss out on the relatively small percentage of investments that provide the meaningfully large percentage of returns. Instead, focus on what matters: diversification, low fees, tax-efficiency, and staying in the market during the ups and the downs.
We don’t know what 2026 holds, but that was true in 2025 and every other year prior. As Ellen wrote at the tail-end of last year, we ended 2025 grateful that you allow us to walk alongside you in good times and bad, and we’re excited to continue that journey with you in 2026 and beyond.
The content above is for informational and educational purposes only. The links and graphs are being provided as a convenience; they do not constitute an endorsement or an approval by Beacon Wealthcare, nor does Beacon guarantee the accuracy of the information.