26 May 2022 Up and to the Right
We all want the investment that does this:
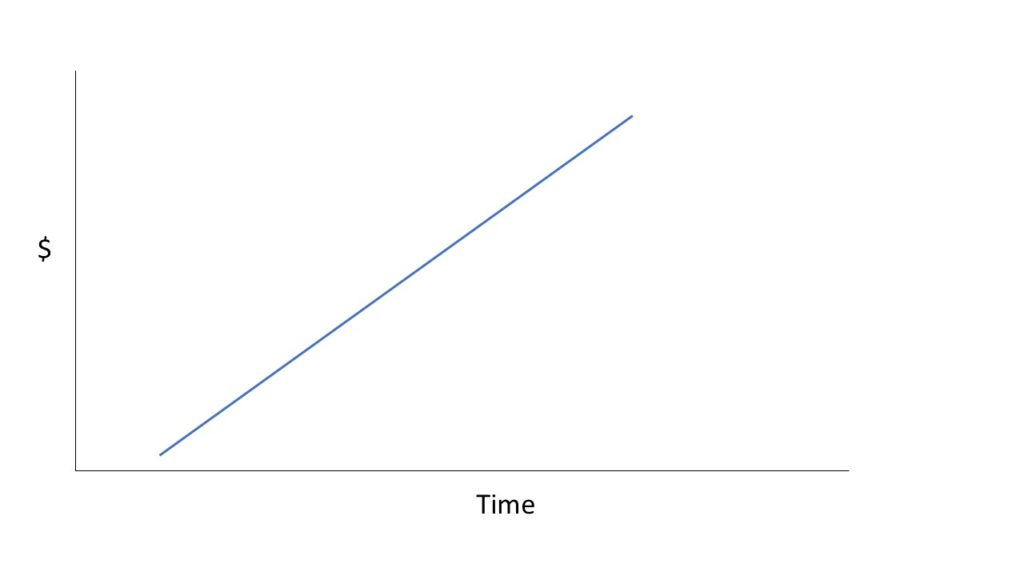
A smooth and steady march up-and-to-the-right.
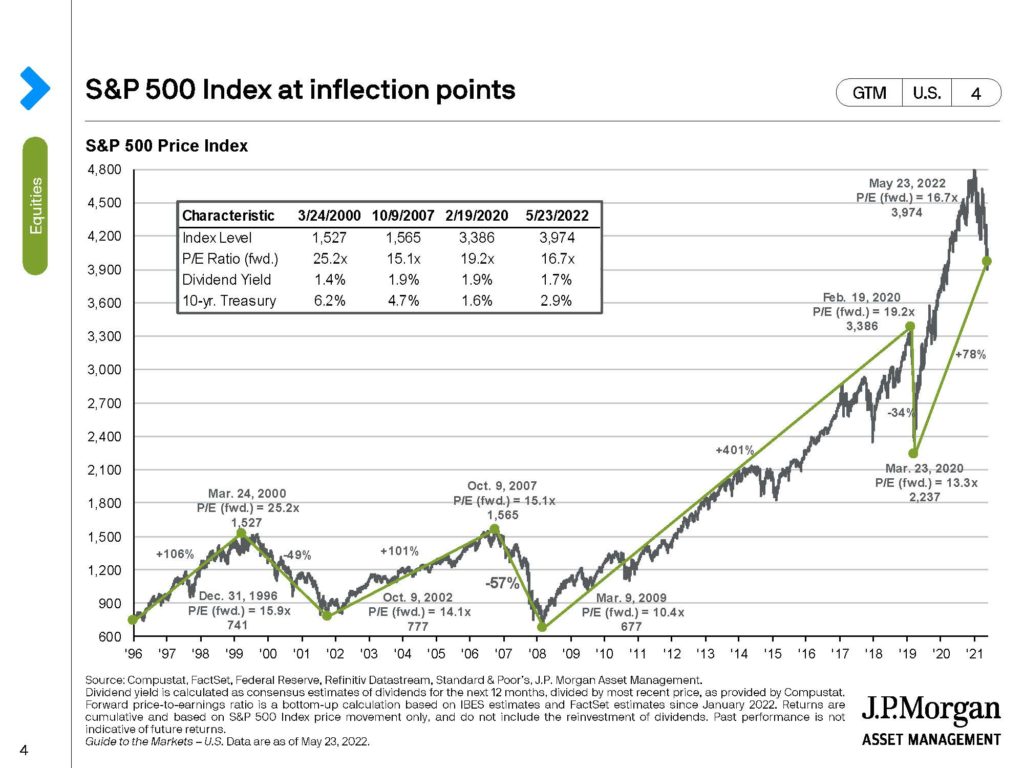
The challenge is the stock market actually does this:
Where things get interesting is when you take the blue line from my hypothetical investment and overlay it onto the second chart showing the actual performance of the stock market. When you do that, you get this:
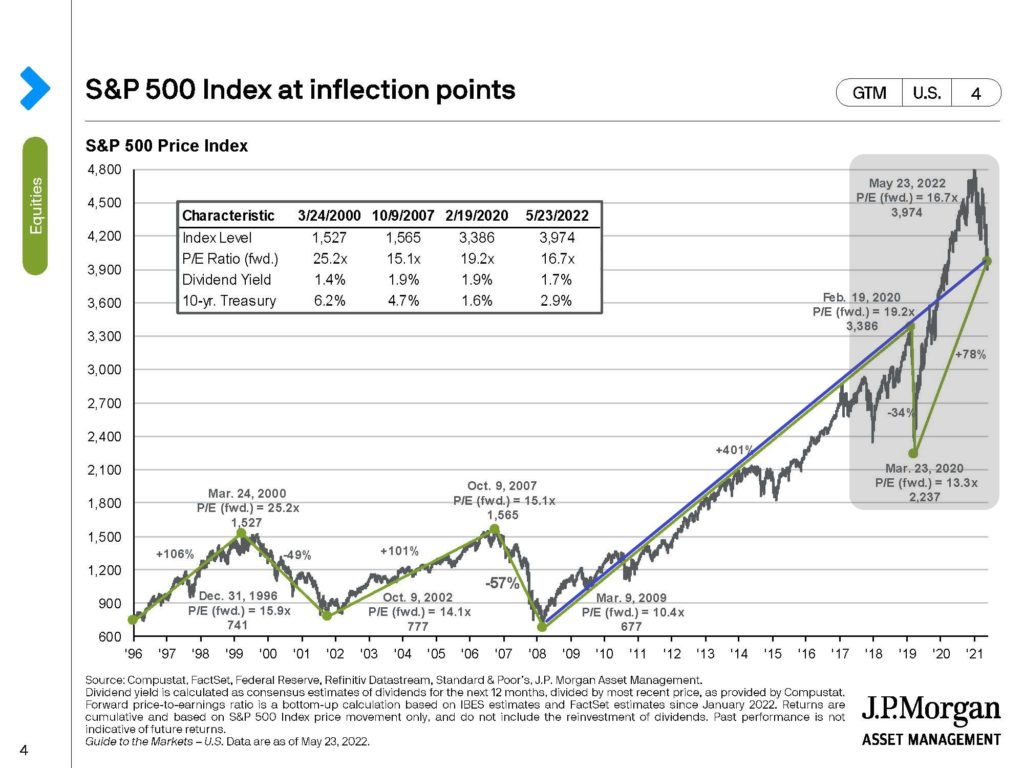
Going back to 2009 and looking at my blue line, you see the S&P 500 has essentially done what my first chart shows. It’s incredible, actually, how the straight blue line that begins in 2009 runs straight through the pre-pandemic peak of 2020 to where we are this week. The trajectory of the market since 2009 has been consistent, a steady march up-and-to-the-right, even when you account for this year. In fact, since 2009 the S&P 500 has averaged just under 14% a year. That’s the good news.
The bad news is what’s in the gray box: A -34% pullback followed by a rally of 100%+ followed by a decline of almost 20% in only 26 months. That’s a lot of volatility, and it’s not isolated to the last 2+ years. Volatility is a staple of the equity markets; sometimes it’s more pronounced than others, but it’s always there. The bumps-and-bruises that come while you’re on the march can take an emotional toll. If we had gone to sleep in February, 2020 and woken up this week, we would most likely be pleased with the balance of our portfolios. But we weren’t asleep. We were awake, and 5 months ago more money was in our accounts. This year’s pullback has been, as Ellen wrote about last week, a Thief of Joy.
But take heart! At some point, the stock market will continue it’s upward trajectory. It will never be as smooth as the one in my hypothetical investment, but we have enough evidence to know it will happen.
Until then, the best thing you can do is focus on what’s in your control: time with family, your saving, your giving, your budget, your performance at work. If worries about your portfolio or the economy are a distraction, give us a call.
Have a fun and restful Memorial Day Weekend!
The content above is for informational and educational purposes only. The links and graphs are being provided as a convenience; they do not constitute an endorsement or an approval by Beacon Wealthcare, nor does Beacon guarantee the accuracy of the information.
**I utilize a lot of J.P. Morgan charts in my writing, and it’s because I find their Guide to the Markets (GTM) to be one of the best resources available. The second and third chart is taken from their daily GTM and runs through May 23rd, 2022. The blue line and gray shaded box were added by me.