24 Mar 2022 This Correction Was Entirely Normal
Earlier this year, the S&P 500 experienced a “correction,” defined as a drop of 10% or more from a previous high. It has rebounded slightly since then, but at its worst was down roughly 13%. In fact, the high point of the last 12 months was January 3rd, the first trading day of the year, almost as if turning the calendar from 2021 to 2022 was all investors needed to start selling off.
The stock market is going through another of those times that test us as investors. If 2022 were to end today, it would be the worst year for the S&P 500 since 2008. Bonds aren’t faring much better, victims of rising interest rates and high inflation. Of course, the war in Ukraine and its multifaceted impact adds layers of uncertainty.
Yet, putting aside the human catastrophe in Europe and Asia (not to mention the oft-unreported tragedies in Africa), what is taking place in the world of investments is surprisingly normal. Here are three reasons why.
Averages
Already mentioned is the 13% correction the S&P 500 experienced earlier this year. To put it in context, it’s the 11th correction this century with three of the previous ten turning in to a bear market. We average a correction once every other year and haven’t had one since 2020.

The degree of the correction was slightly less than average over the last 42 years. The chart below, from JP Morgan’s Guide to the Markets, shows annual returns (gray bars) going back to 1980 along with the intra-year pullback (red dots). Data as of March 22nd, 2022.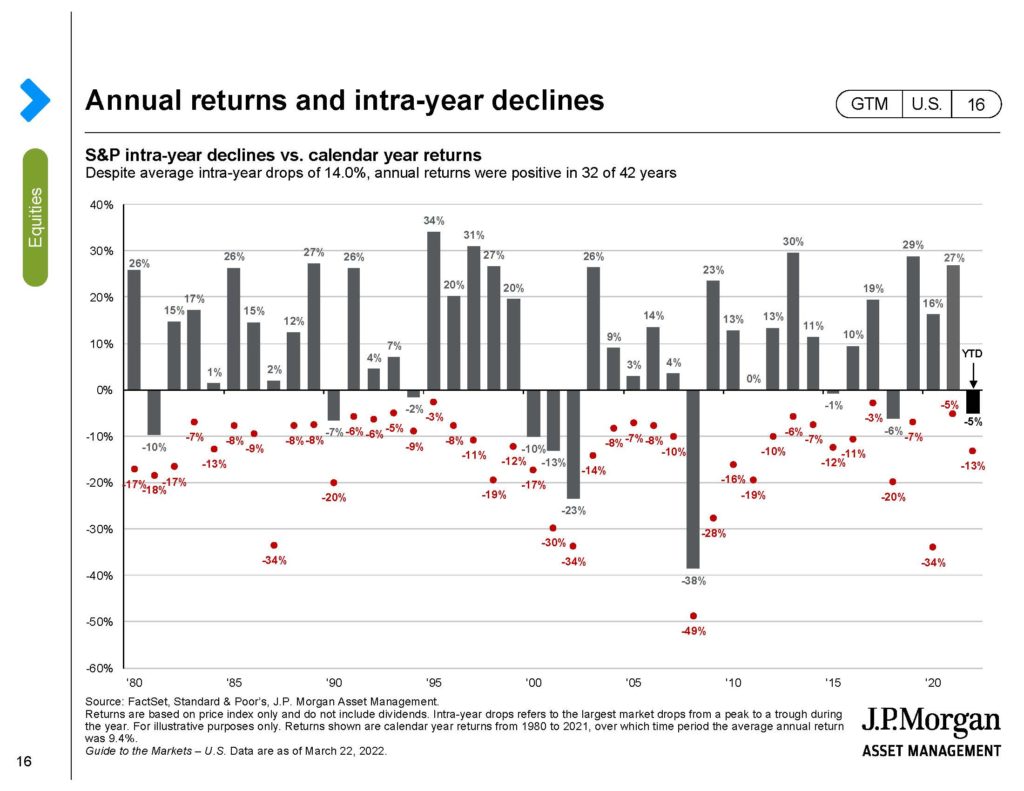
As you can see, the average pullback from January 1st-December 31st each calendar year is 14%. Yet, despite that, the market finished positive in 32 of the 42 years with an average annual return of 13.47%.
Combine a correction slightly less than average and the fact that we hadn’t experienced a correction in a few years and we already have an argument that this year has been entirely normal.
(By the way, do you remember the two corrections in 2015? How about 2018? Me neither!)
Valuations
The most commonly used metric to value the stock market is the price-to-earnings ratio, or “P/E” ratio. You can apply it to a market as a whole, the S&P 500, for example, or an individual stock. By dividing the stock price by the earnings per share of stock you come up with the P/E ratio, which tells us how many times current earnings an investor is willing to pay for a stock, index, etc.
Over the last 25 years, the P/E ratio has been 16.85. Anything higher than that number means the S&P 500 is relatively expensive, and the more expensive, the lower your future returns project to be.
At the start of the year, the P/E ratio was approaching 23, as expensive as it’s been in over 20 years. Look at the chart below, again from JP Morgan: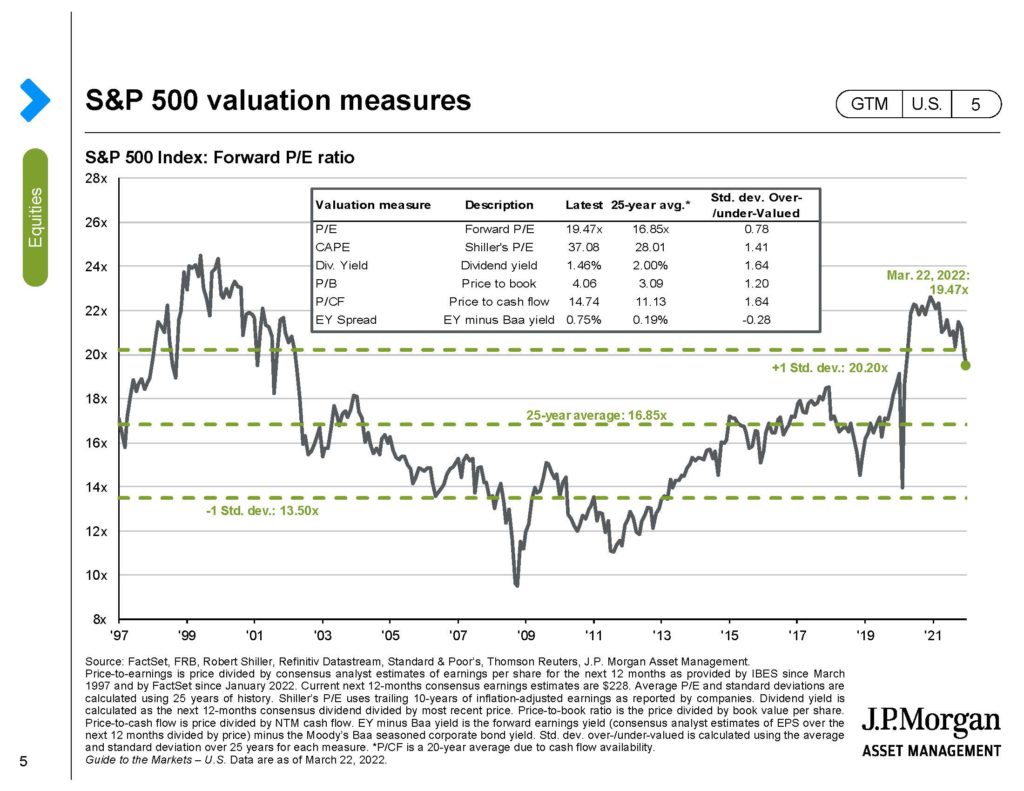
This year’s correction has brought to P/E ratio to 19.47, closer to long-term averages. A market rebound could elevate valuations again or they could continue to fall as prices retreat and/or earnings impress, but the pullback earlier this year has taken a bit of the froth off. While uncomfortable, in the long-term it’s helpful, even necessary, for prices to fall so valuations can move towards long-term averages.
Recovery
Think back to March of 2020. The economy was shut down. Most states were in the beginnings of a stay-home order. The streets were quiet. Emily and I unloaded groceries in our driveway and wiped them down with sanitizing wipes before bringing them into the house. Remember? Now imagine during that time someone promised you in two shorts years the stock market would be up 102%. How would you have felt? Would you have believed them?

Focus on the green area in the chart above, you can see the S&P 500 bottomed on March 23rd, 2020. Since then, it’s more than doubled, incredible performance in such a short time. The Fed provided the stock market the equivalent of an espresso IV for two years. Now, as inflation shows up and fears of an overheating economy take-hold, they are responding by raising rates. As anyone who’s experienced a caffeine-high knows, coming down can be rough. After doubling in less than two years, it’s perfectly reasonable to think the market would give some of those gains back. While returns year-to-date can leave us wanting, we should find solace in what’s occurred over the last 24 months.
What’s more, the returns going all the way back to 2009 are nearly unparalleled: $10,000 in the S&P 500 index on January 1st, 2009, would have been worth over $67,000 on January 1st of this year. That’s an average annual return greater than 16%.
In Closing
As Jared said last week, “it’s our job to care well for your portfolio, because it’s one of many important parts of your financial journey, but also because we want you to be freed up more and more each day from worrying or obsessing over it.” Our hope is you can see that what’s taken place this year is a normal part of your investing journey. Normal and healthy.
So where do we go from here? No one knows. The stock market is inherently unpredictable in the short-term. Add in significant economic and geopolitical issues, and the short-term becomes even more incalculable. A compelling case could be made that the stock market will be higher by the end of the year thanks to a peace agreement between Russia and Ukraine and blowout earnings as a result of rising prices. An equally compelling case could be made that the full impact of high inflation and rising interest rates hasn’t been felt yet, and that the longer the war in Ukraine drags on, the harder it will be for global economies to avoid a recession. No matter what happens, you can be sure we are working hard to care well for your portfolio.
“Normal” doesn’t necessarily mean “easy.” If you find yourself worrying about your investments or obsessing over the state of your financial plan, call us.
The content above is for informational and educational purposes only. The links and graphs are being provided as a convenience; they do not constitute an endorsement or an approval by Beacon Wealthcare, nor does Beacon guarantee the accuracy of the information.