10 Mar 2022 College – What’s it Worth?
Ahh, spring. The season when days get longer, flower bulbs emerge, and sneezing fits from allergies return. Plus, it’s every high school senior’s (and their parents’) favorite time of year – college decision season! Acceptance letters and financial aid offers arrive by mid-April, with most acceptance deadlines on May 1. There are many factors to consider when choosing a school, and recently, we’ve seen an uptick in people questioning whether it’s worth even taking the traditional 4 year public or private college path. A few years ago, Ryan wrote about whether college was a good investment, and Georgetown University’s Center for Education and the Workforce (CEW) just added more metrics to their tool to help examine that very question.
I want to preface this with a reminder that every person is more than the school he/she attends, and the decision is not as straightforward as choosing the school with highest ROI from this database. However, often for a prospective student, thinking through potential ROI moves to the bottom of the list compared to the student body, campus life, available majors and programs, sports, cost (from cash flow perspective), class size, and location – just to name a few of the competing factors. Isolating your choices with statistics that take a long-term perspective may be a helpful practice as you, or your child, face this decision. College is a financial investment, among other things, and you may help prevent negative surprises after graduation by going through the exercise of comparing potential returns on tuition/room/board.
Georgetown’s Center for Education and the Workforce used data from the USDOE College Scorecard to calculate several key metrics for use in comparing potential schools. Their initial report was released in 2019, but this latest edition added a new metric to compare the percent of students whose earnings 10 years after enrollment are above workers with only a high school diploma. The database allows you to filter by institution type, degree type, and states, among others. There are 4,500 schools, so I would filter down to your state at a minimum as you start to look through the results. Their press release highlights some of their findings, including that “an average of 60% of college students across institutions earn more than a high school graduate after 10
years.” You can toggle between two views of the chart by clicking the blue “Net present value” and “Scorecard measures” buttons at the top left of the chart.
Some of their metrics are defined below:
- Net Present Value (NPV): How much a sum of money in the future is valued today – in this case, it’s measuring potential future earnings. This number allows you to weigh the costs of investing in college now vs potential gains over time. Their calculations included a lot of variables, which can be found on their initial report if you’re interested in diving deeper into the numbers.
- NPV at 10 and 40 years: Generally, people focus on the long-term perspective of NPV to judge value of college, but sometimes a shorter-term time frame is helpful. If you think about a student entering college at age 18/19, NPV at 40 years looks out the length of almost a full career to when the student is 58/59.
- Average Annual Net Price: Tuition, fees, books, supplies, and living expenses, minus aid from all sources. This provides a figure to represent total investment.
- Graduation Rate: The percentage of students who earn their bachelor’s degree within 6 years.
Whenever you invest, analyzing potential risk is a key part of the decision process. You don’t want to take more risk than necessary for the same (or lower) expected return.
The efficient frontier of modern portfolio theory charts risk vs. expected return to determine an appropriate combination of assets. You can then compare your risk-reward tradeoff on the efficient frontier to determine your optimal portfolio. Likewise, for a college decision, your total expense, and/or total debt accrued, impacts your total return. Median debt levels for a school indicate how long a graduate may be diverting earnings toward debt payments. Graduation rate also impacts your risk – you may take on debt without finishing the degree that is correlated with the increased lifetime earnings! You could use this database with a similar approach to using the efficient frontier to plot portfolios. Rather than charting risk vs expected return, you’re looking at expected cost vs how much potential future earnings is valued today. Granted, this is just one element of the multi-faceted decision.
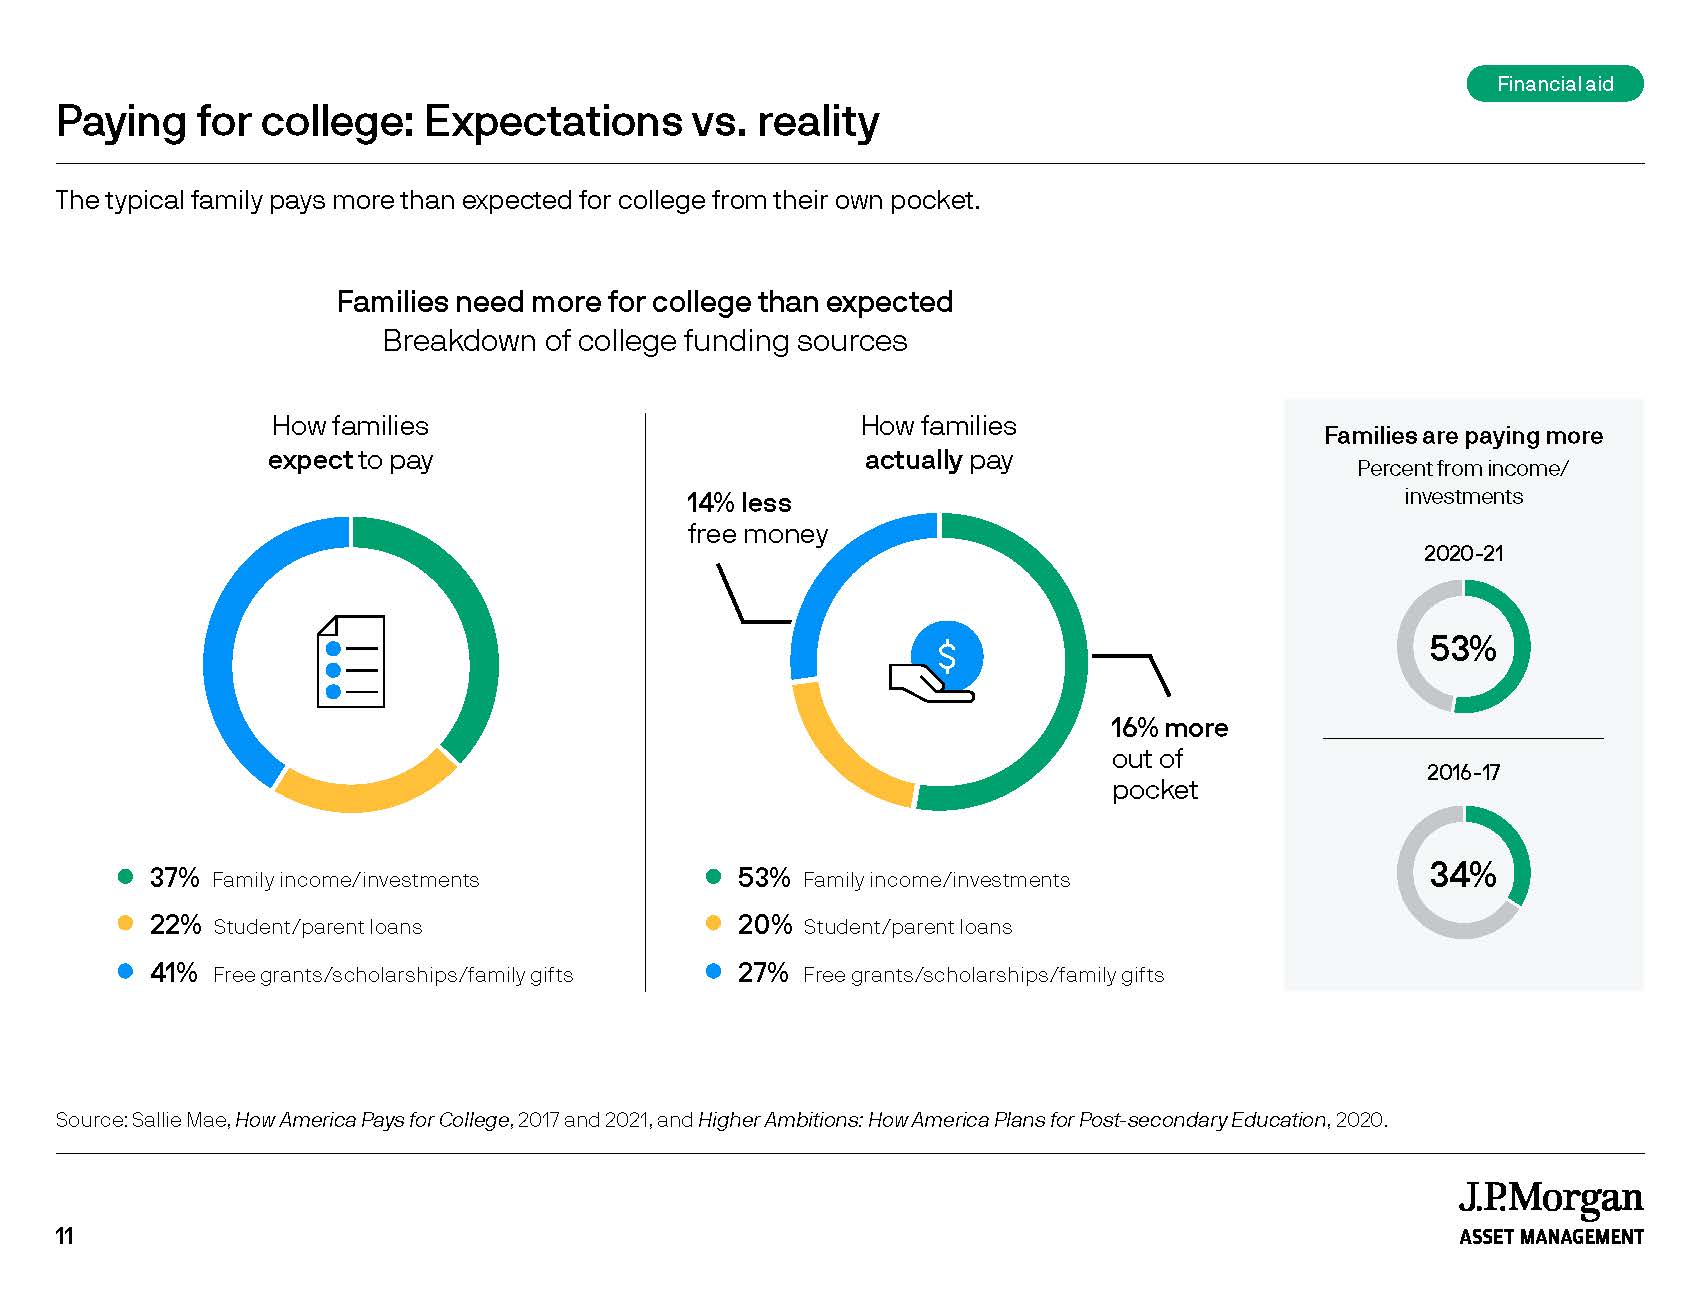
Expectations often differ from the reality of how a family covers the cost of college. The chart below demonstrates that many families inflate the amount of free money that they’ll receive from either grants, scholarships, or gifts. More comes out of pocket than expected, and part of our job is to start the conversations early to limit unpleasant surprises. Planning early and clear communication are important when we discuss college planning with our clients. Planning early allows your hard-earned savings to be working for you longer, providing more potential for appreciation. Clear communication is important to ensure students understand the investment made in their future with education expenses. Additionally, students need to understand the implications of student debt or an expected contribution toward college expenses.
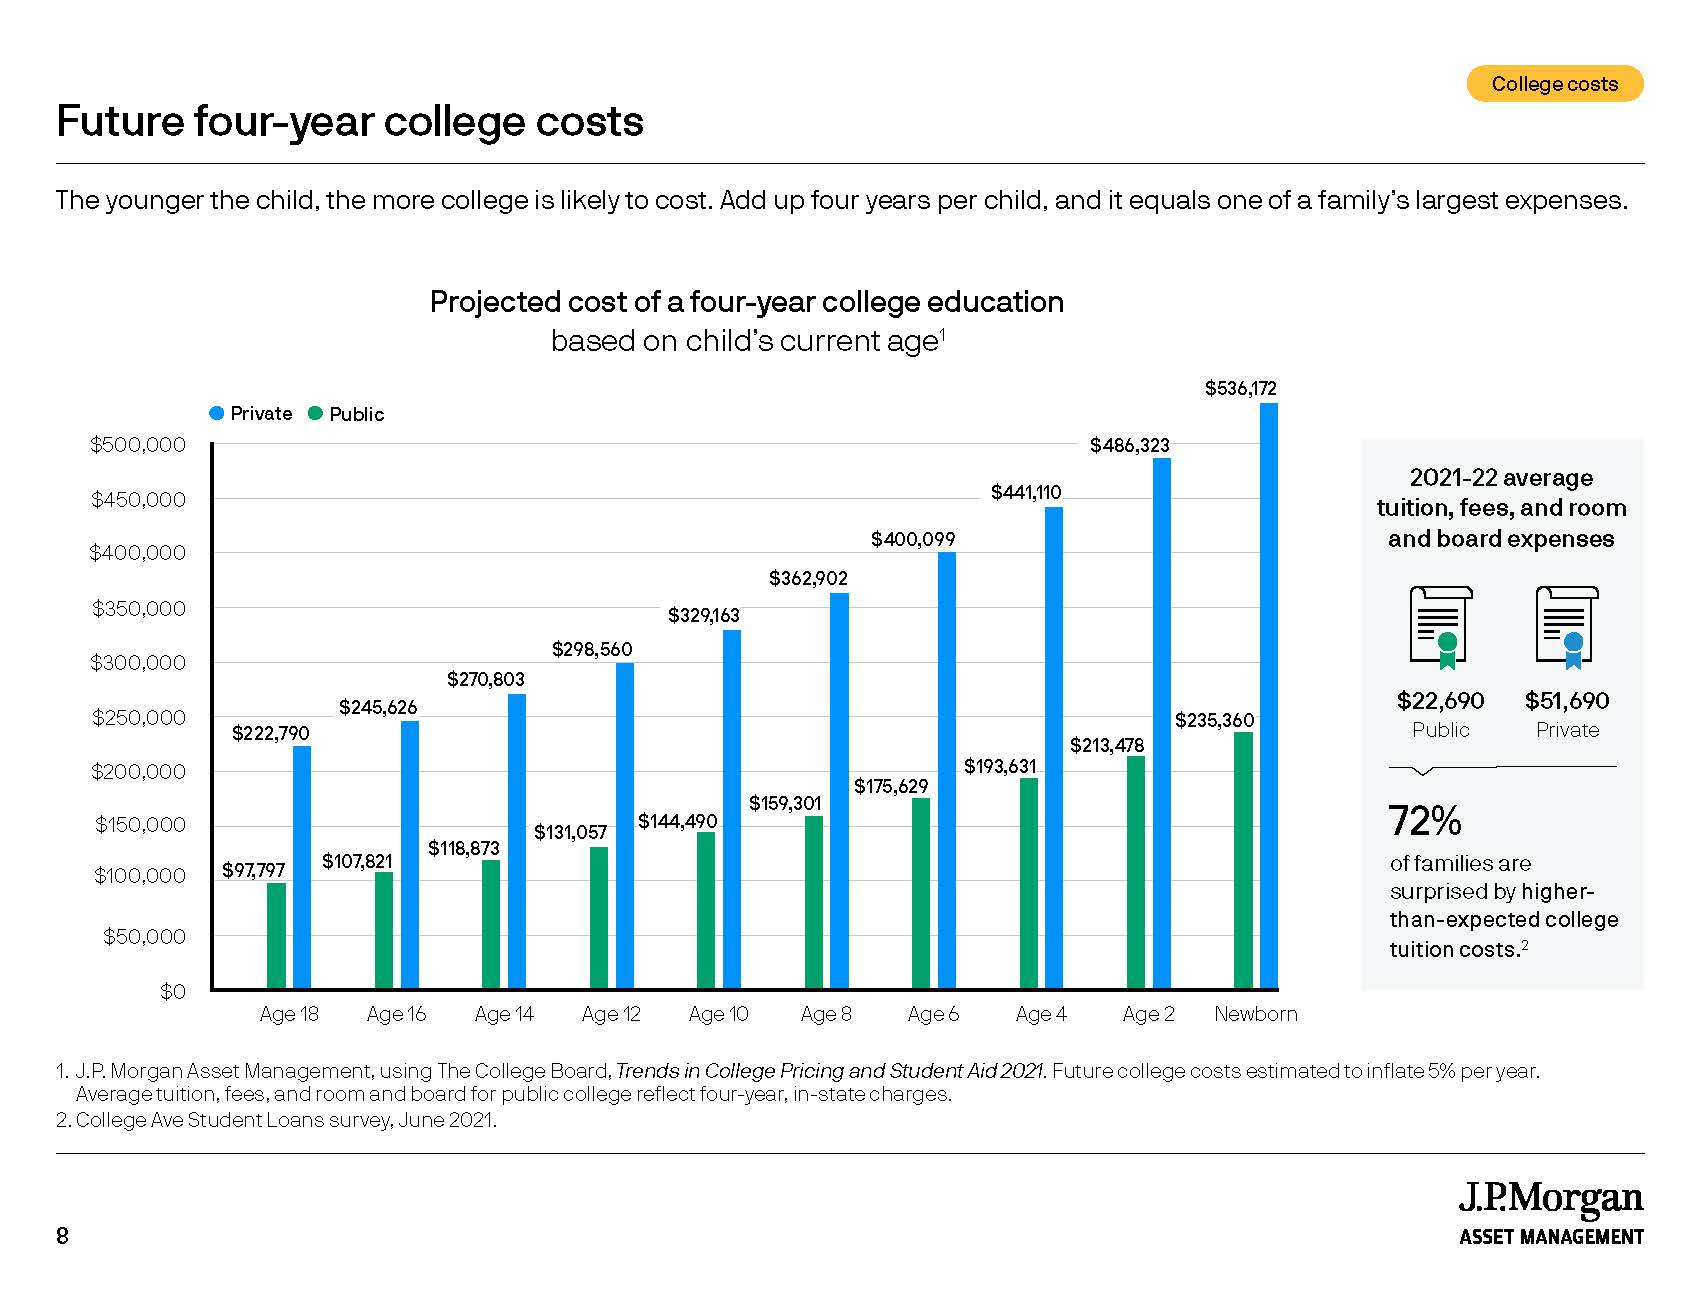
Inflation is another buzz word in the news lately. One of the many fascinating shifts caused by the pandemic is how college tuition declined from the 2020-21 to 2021-22 enrollment if you include the effects of overall inflation! On average, according to the College Board, public in-state school tuition increased 1.6%, private school tuition increased 2.1%, and inflation increased 5.3% for that same period. Student enrollment also decreased, so colleges are trying to keep the demand high. We typically use 4.5% as our inflation rate for college costs based on most recent trends. Below is another chart that demonstrates projected cost of a four-year education based on a child’s current age, inflated at 5% per year.
Alternatives to the traditional four-year college route are plentiful. I’ve noticed an increase of articles offering that advice, and right now, the data still leans toward the four-year school route. On average, graduating from a technical program often provides similar 10-year NPV values but the upside is greatly limited once you extend to 40-year NPV values. Some states, like North Carolina and Virginia, also have programs where achieving a certain GPA at a two-year community college provides guaranteed acceptance to certain in-state schools. That option offers one way to mitigate risk, reduce overall expenses, and obtain a bachelor’s degree. This doesn’t come without sacrifices, but that’s part of examining a risk-reward tradeoff!
All in all, we hope to be a helpful resource to our clients when planning for this future, or current, expense. With everything happening in the world right now, I feel immense privilege that I’m able to sit in a comfortable office to write about higher education trends. We hope to offer perspective and meaningful advice for your life – so let us know if you need help sorting through all the competing factors in the college decision making process.
The content above is for informational and educational purposes only. The links and graphs are being provided as a convenience; they do not constitute an endorsement or an approval by Beacon Wealthcare, nor does Beacon guarantee the accuracy of the information.