08 Jun 2023 A Narrow Rally and Other Market Thoughts
On Friday, June 2nd, the S&P 500 closed at 4,282.37, which on its own is meaningless. Combined with where it closed on October 12th, 2022 (3,577.03), and we see that it got as close as possible to a bull market rally without actually realizing it, which is meaningful. A bull market begins when an index or investment is up 20%+ from a previous low, and last Friday the S&P 500 closed up 19.7% from the October 12th low. It’s been a quiet rally because more than a third of it came in the last 10 weeks of 2022, which was a bad year across every major asset class, and because this year we were all distracted by the negotiations around the debt ceiling.
Focusing on this year, we see the three primary investments in our client portfolios are enjoying positive performance:
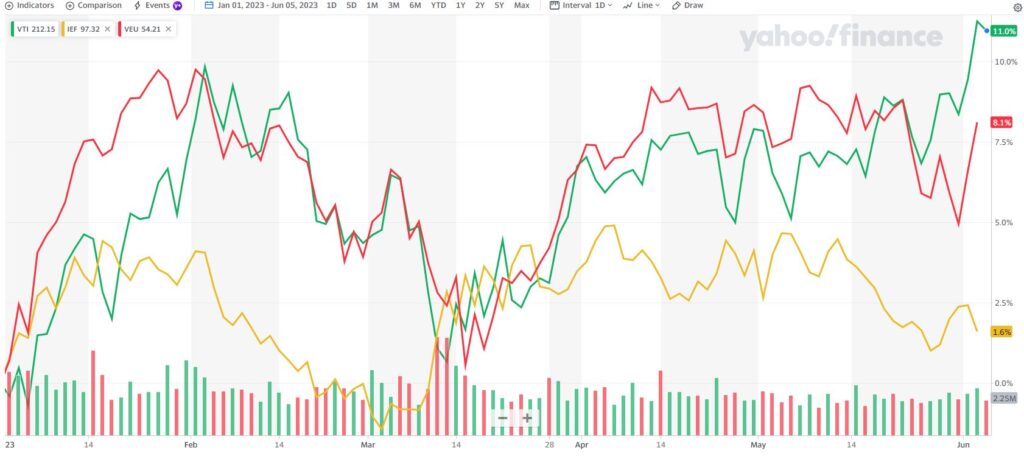
The green line is the Vanguard Total Stock Market ETF. Through Monday, June 5th, it is up 11%. The Vanguard FTSE All World ex US ETF (think: the global economy minus the United States), the red line, is up 8.1%. The gold line, the iShares 7-10 Year Treasury Bond ETF, is up 1.6% and yields more than 3.5%, nearly 3x as much as it did 18 months ago.
Fueling the rise in the S&P 500 is a smaller than normal number of companies:
Most of the companies leading the way are technology companies, as the sector continues to dominate the overall market. In fact, Apple (+43%), Microsoft (+40%), Nvidia (+172%), and Google (40%) are five of the six largest stocks (Google takes up two spots due to different share classes) in the S&P 500. (Click here for a full list.)
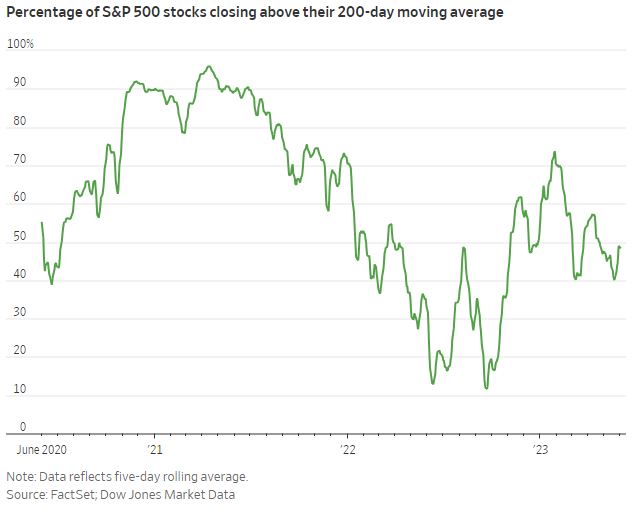
We would say this a “narrow rally,” which isn’t the healthiest type. The Wall Street Journal has this to say:
One sign of narrowing breadth can be seen in how the S&P 500 has fared this year compared with its equally weighted counterpart, which gives equal sway to every company in the index. Compared with the traditional index’s 11% gain, the equally weighted version has added 1.1%. That is the largest-ever outperformance by the S&P 500 on a year-to-date basis. . . . (L)imited breadth can often precede a downturn. S&P 500 returns over the next month, three months, half-year and year tend to be negative when fewer than 48% of stocks are trading above their average over the past 200 days.
Adding more weight to the “narrow” argument is sector performance. The Consumer Discretionary sector (Amazon, Tesla) is up 22.9%, Tech (Google, Nvidia, Apple, Microsoft) is up 34.6%, and Communication Services (Facebook) is up 36.4% (all figures are through June 2nd, 2023). No other sector is up more than 3.3%, with energy being the worst, down -7.7%.
Moving on to inflation, we see positive news. After peaking at 8.9% year-over-year in June of 2022, it dropped to 4.9% in April of this year (May’s numbers will come out next week).
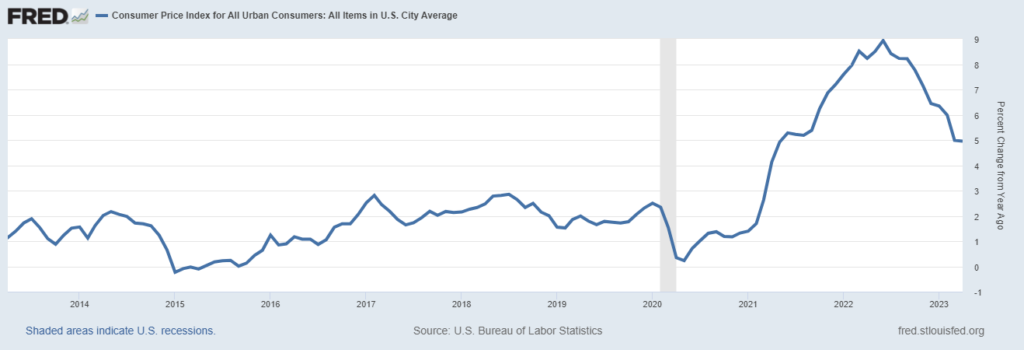
Much of the improvement is due to the reduction in the price of barrel of oil, which cost $123.70 in March of last year and now sits at just under $72, though prices have inched up this week on news that OPEC will continue cutting production.
What continues to have a strong influence over market movements is Federal Reserve Policy. Over the last 18 months they have increased the Federal Funds Rate from 0.08% to 5.06% in an effort to cool inflation.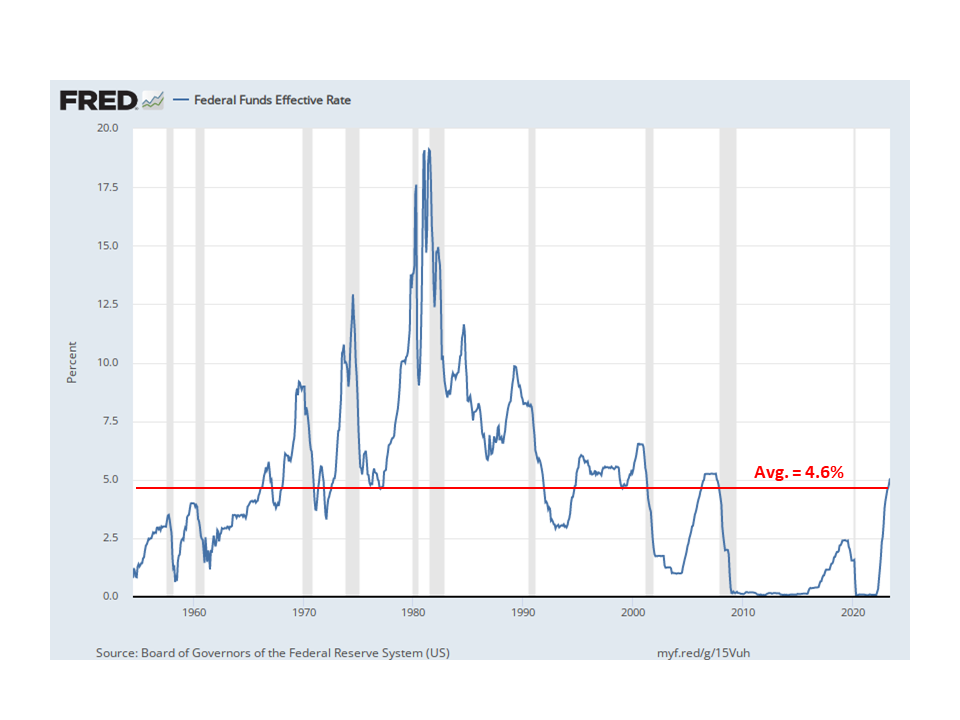
As we’ve seen, inflation is coming down and thus far the economy has avoided tipping into a recession. The Fed is expected to leave rates where they are at their next meeting and have been non-committal about future increases.
We’ll close with how consumers in the aggregate are feeling. Typically, consumer confidence tends to be negatively correlated to how the stock market performs. That is, when consumers are their most optimistic, there is a greater likelihood of a market pullback. Alternatively, when consumers feel their worst, stocks are more likely to move up rather than down. It’s not perfect, of course (that would be too easy), but it is one of a handful of helpful indicators.
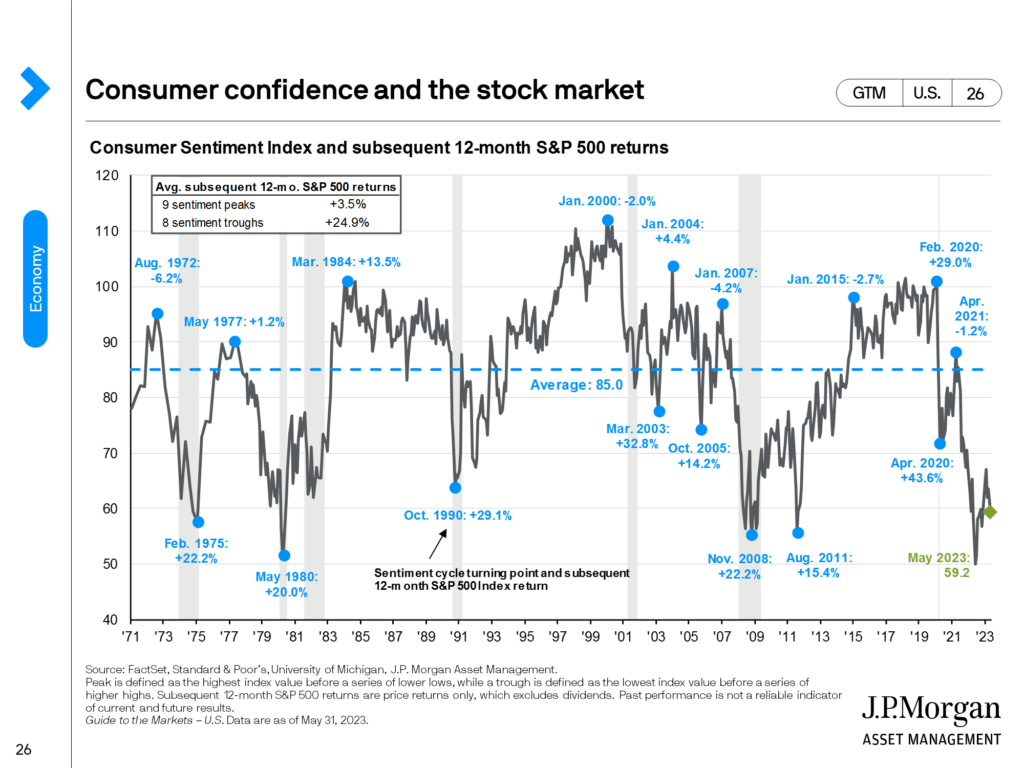
The current reading is 59.2 and by looking at the chart it’s clear that consumers are feeling pretty lousy. In fact, we’ve collectively felt worse during only four other periods of time, and three of them came during recessions. Interestingly, and on brand, is that despite how consumers have felt/are feeling, the stock market has performed great.
As you’re reading this, you may be wondering if all this paints a rosy outlook for the market or a gloomy one. My response: yes. It’s just as easy to say the current narrow rally is sustainable because of the limitless possibilities of AI as it is to say it’s overextended and needs to pullback; That moderating inflation will continue or low oil prices have masked persistent price increases; That the Fed has pulled off a “smooth landing” or the economy is still too hot and rates need to go higher. There’s a lot of uncertainty, but that’s always the case. The uncertainty we feel as investors is the entry fee to the stock market. It’s unavoidable, but, as Geoff wrote about two weeks ago, there’s plenty we can do to manage it.
One way to manage it is by talking about it. So if you’re feeling nervous, let us know so we can set up a time to chat.
The content above is for informational and educational purposes only. The links and graphs are being provided as a convenience; they do not constitute an endorsement or an approval by Beacon Wealthcare, nor does Beacon guarantee the accuracy of the information.